Custom iOS plugin optimization is essential for improving Capacitor app performance. It ensures faster, smoother, and more stable functionality for both developers and users. Here’s a quick summary of the key practices:
- Bridge Communication: Batch and compress large data payloads to reduce latency.
- Memory Management: Avoid memory leaks by using weak references and releasing large resources promptly.
- Swift Code Optimization: Use value types and validate inputs early for better performance.
- Xcode Settings: Enable features like Dead Code Stripping and Link Time Optimization to improve speed and reduce binary size.
- Performance Testing Tools: Regularly use Xcode’s Time Profiler, Allocations, and Leaks to identify and fix bottlenecks.
How senior iOS devs profile and solve performance issues with Instruments.app | Live Dev Mentoring
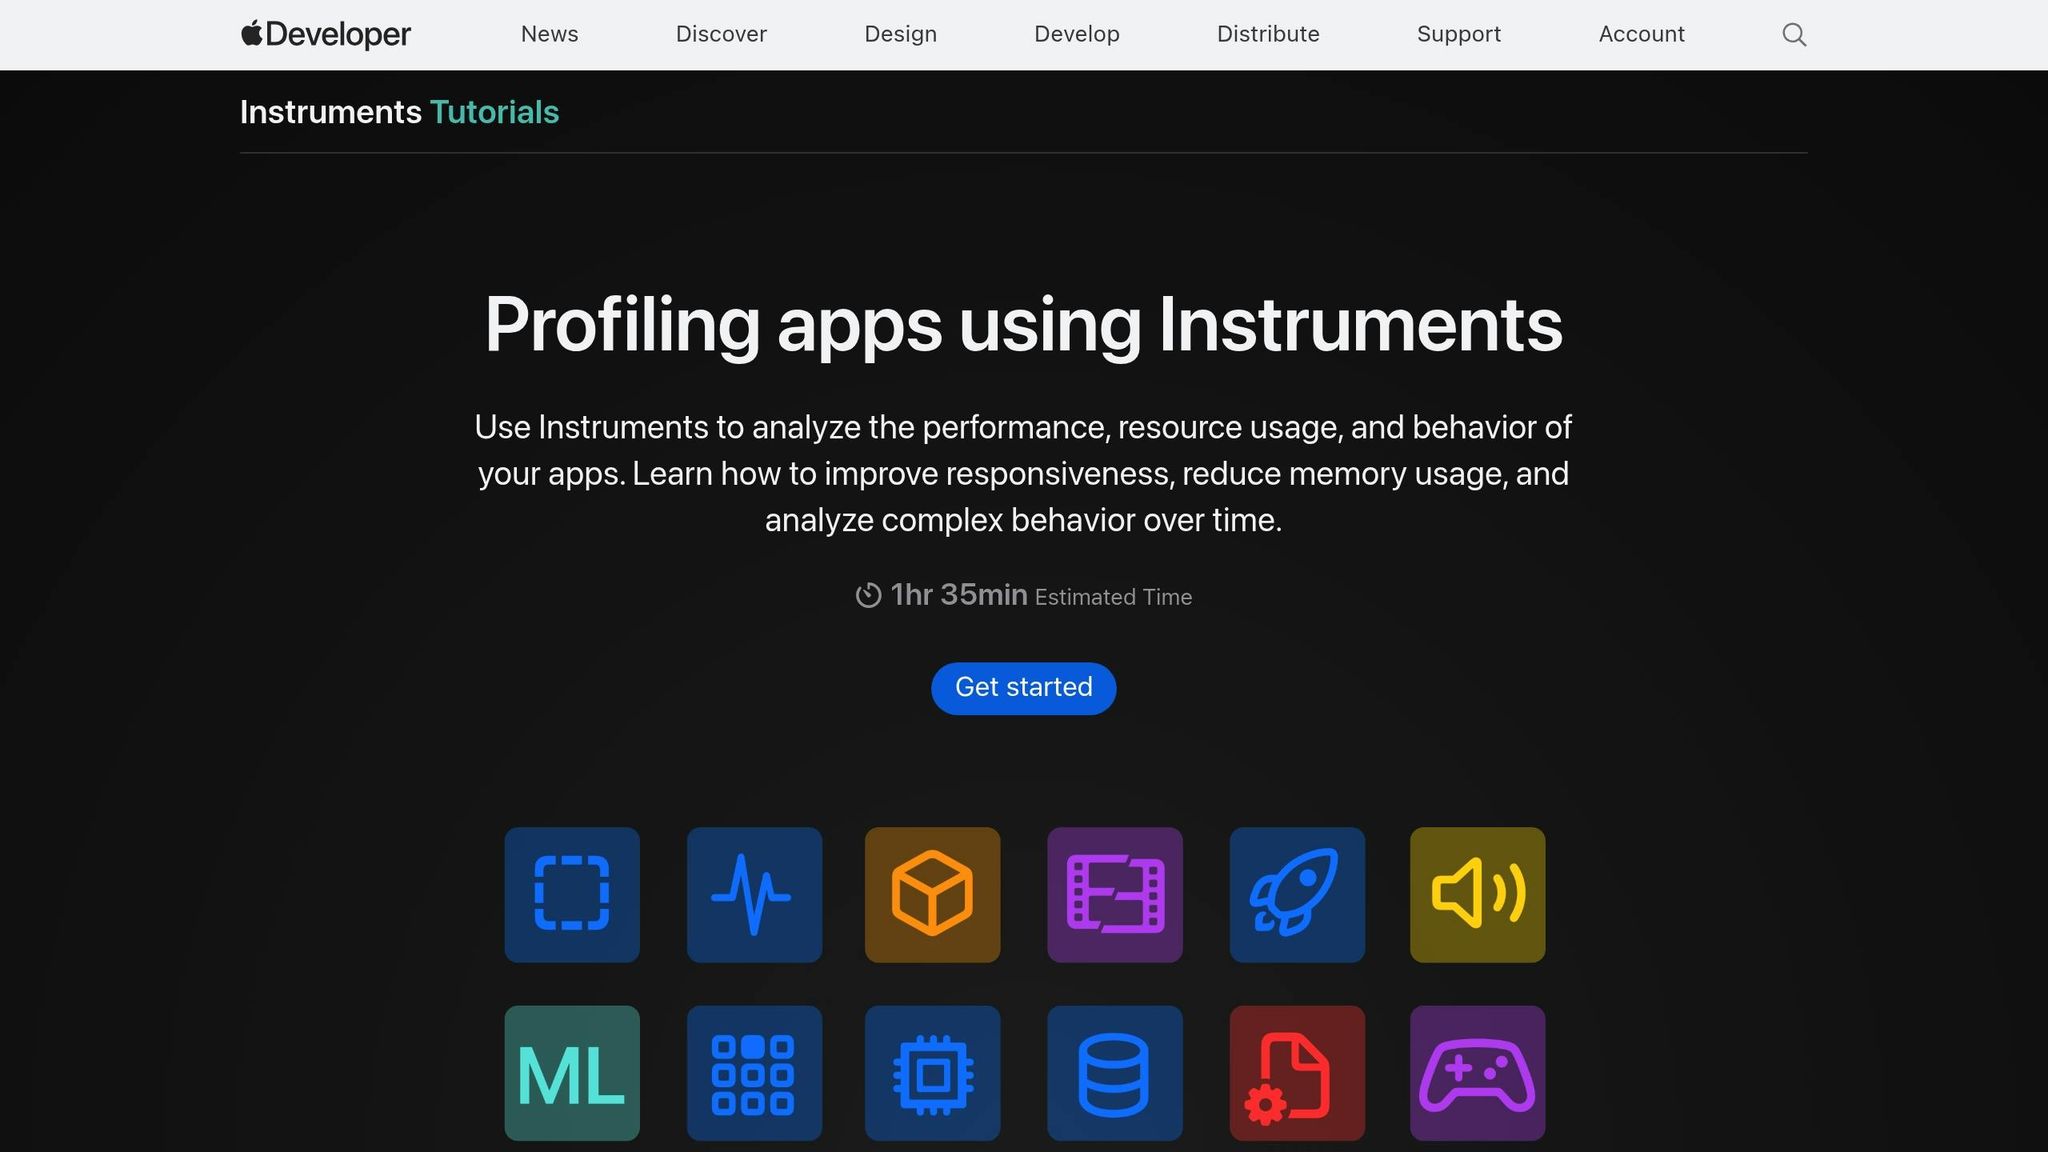
Core Optimization Methods
Boost your plugin’s performance by fine-tuning bridge calls, managing memory more effectively, and optimizing Swift code.
Reducing Bridge Communication Load
The interaction between JavaScript and native iOS code can slow things down if not handled carefully. To ease this bottleneck, focus on making your data transfers as efficient as possible:
| Data Type | Optimization Strategy | Performance Impact |
|---|---|---|
| JSON Objects | Simplify structure, remove redundancy | Better responsiveness |
| Binary Data | Use base64 encoding selectively | Faster, more efficient processing |
| Large Payloads | Batch process data | Fewer bridge calls, smoother operation |
By compacting data and minimizing JSON payload sizes, you can cut down on serialization overhead. Testing with Xcode’s Instruments has shown that these adjustments significantly reduce serialization and deserialization times, leading to a noticeable improvement in plugin responsiveness [2][5].
Once bridge communication is optimized, the next step is to fine-tune memory management.
iOS Memory Handling
Good memory management is essential for keeping your plugin stable and preventing crashes. Here are some practical steps to manage memory effectively:
- Use weak references for delegate patterns to avoid retain cycles.
- Release large resources, such as images or media files, as soon as they’re no longer needed.
- Regularly monitor memory allocation and profile your app using Xcode’s Instruments to catch potential leaks early.
After addressing memory concerns, you can focus on improving the efficiency of your Swift code.
Swift Code Performance Tips
Swift provides several tools to help optimize your code. Concentrate on these areas to get the most out of your plugin:
| Optimization Area | Implementation | Benefit |
|---|---|---|
| Value Types | Use structs for data models | Lower memory usage |
| Parameter Validation | Validate inputs early | Avoid unnecessary processing |
| Type Safety | Rely on Swift’s strong typing system | Enables better compiler optimizations |
By validating parameters upfront and taking advantage of Swift’s strong type system, you can prevent unnecessary processing and allow the compiler to optimize your code more effectively [2][4].
These strategies, when combined, can significantly enhance the overall performance and stability of your plugin.
iOS-Specific Improvements
To take your iOS plugin to the next level, fine-tuning its performance with platform-specific optimizations is essential. By leveraging the right Xcode settings and testing tools, you can improve both speed and efficiency. Let’s break it down.
Xcode Performance Settings
Tweaking Xcode’s build settings can significantly enhance your plugin’s performance while keeping its size in check. Here’s a quick overview of the key configurations:
| Build Setting | Configuration | Impact |
|---|---|---|
| Build Configuration | Release | Activates all performance optimizations |
| Link Time Optimization | Enabled | Speeds up execution |
| Dead Code Stripping | Enabled | Reduces binary size by up to 20% |
| Swift Optimization Level | -Owholemodule | Boosts overall performance |
For instance, enabling Dead Code Stripping and setting the Swift Optimization Level to -Owholemodule can trim your plugin’s size while ensuring faster execution speeds [2]. Once these settings are in place, it’s time to measure their impact using Xcode’s built-in tools.
iOS Performance Testing Tools
Xcode offers a suite of tools designed to analyze and optimize performance. Here’s a rundown of the most useful ones:
| Tool | Primary Use | Key Metrics |
|---|---|---|
| Time Profiler | Analyzing CPU usage | Method execution times |
| Allocations | Tracking memory usage | Object allocation patterns |
| Leaks | Detecting memory issues | Identifies retain cycles and leaks |
| Debug Navigator | Real-time monitoring | Tracks resource usage stats |
Here’s how to get the most out of these tools:
- Test in Real Scenarios: Simulate realistic data loads and user interactions to get accurate performance insights.
- Monitor Memory Usage: Use the Allocations tool to keep an eye on memory consumption and avoid unnecessary overhead.
- Set Benchmarks: Automate performance testing with XCTest to track metrics over time.
Make it a habit to profile your plugin regularly with tools like Time Profiler, Allocations, and Leaks. This will help you pinpoint performance bottlenecks and ensure your plugin operates smoothly and efficiently [5].
Plugin Setup and Release Steps
Setting up and releasing iOS plugins involves a meticulous approach to managing dependencies, ensuring seamless updates, and adhering to App Store guidelines. Here’s a breakdown of the key practices to ensure a smooth deployment process.
Managing Plugin Dependencies
Properly managing dependencies is crucial for maintaining your plugin’s performance and stability. Here’s a quick overview:
| Dependency Management Tool | Best Practice | Impact |
|---|---|---|
| CocoaPods | Use explicit versioning | Prevents compatibility issues |
| Swift Package Manager | Enable static linking | Reduces binary size |
| Manual Integration | Avoid when possible | Reduces maintenance complexity |
For example, when using CocoaPods, you can specify versions like this:
pod 'ExampleSDK', '~> 2.0.0'pod 'AnalyticsLib', :git => 'https://github.com/example/analytics.git', :tag => 'v1.2.3'By carefully selecting and configuring dependencies, you reduce risks and ensure a stable foundation for your plugin.
OTA Updates with Capgo

Once dependencies are streamlined, the next step is ensuring your plugin evolves smoothly over time. Over-the-air (OTA) updates are a game-changer, and Capgo is a powerful tool for rapid deployment while staying compliant with App Store rules. According to recent data, 95% of active users receive updates within 24 hours using Capgo’s distribution system [1].
To make the most of Capgo, follow these steps:
- Configure update channels: Use staged rollouts to test updates with smaller user groups first.
- Enable partial updates: This minimizes bandwidth usage and speeds up the update process.
- Set automatic rollback triggers: Quickly revert updates if critical errors occur, ensuring user experience isn’t disrupted.
App Store Guidelines
Finally, compliance with App Store guidelines is essential for a successful release. These guidelines ensure your plugin is efficient and adheres to Apple’s standards. Key areas to focus on include:
| Requirement | Implementation | Verification Method |
|---|---|---|
| Architecture Support | Build for arm64 and x86_64 | Validate in Xcode |
| Binary Size | Enable dead code stripping | Use build analyzer reports |
| Resource Optimization | Use asset catalogs | Check Xcode size reports |
Additionally, document your API usage thoroughly and avoid using private or restricted frameworks to meet Apple’s privacy rules [2]. Employ techniques like lazy loading and Xcode app thinning to optimize resource usage and improve both startup and runtime performance [3].
Summary
Here’s a quick breakdown of the best practices for optimizing custom iOS plugins in Capacitor and how they can enhance app performance. The focus lies on improving performance, managing memory usage, and ensuring efficient bridge communication, all of which contribute to better app responsiveness and resource management.
Key Optimization Insights
The table below highlights critical areas of optimization, their measurable impacts, and the benefits they bring:
| Optimization Area | Impact | Implementation Benefit |
|---|---|---|
| Bridge Communication | 434ms average API response time [1] | Lower latency and smoother data flow |
| Memory Management | 95% active user update rate within 24 hours [1] | Improved stability and resource use |
| Swift Performance | 114ms download speed for 5MB bundles [1] | Faster execution and better user experience |
Key Focus Areas for Developers
To achieve these performance improvements, developers should prioritize:
- Bridge Communication: Batch and compress large data payloads to minimize latency.
- Memory Management: Leverage weak and unowned references to optimize resource usage.
- Swift Optimization: Use value types and copy-on-write semantics for better performance.
- Testing Tools: Regularly profile with Xcode Instruments to identify and address bottlenecks.
FAQs
::: faq
How does optimizing bridge communication in custom iOS plugins improve app performance?
Optimizing bridge communication in custom iOS plugins is a smart way to boost app performance. By reducing latency and improving how data flows between the native and JavaScript layers, you can achieve smoother interactions, faster responses, and an overall better user experience.
To get there, it’s important to limit the data sent through the bridge, combine multiple calls into batches when possible, and cut down on unnecessary back-and-forth exchanges. Tools like Capgo can make this process even easier. They allow for instant updates, helping your app stay fast and current without the hassle of constant app store submissions. :::
::: faq
What are the best practices for optimizing memory usage in custom iOS plugins to avoid crashes?
To make your custom iOS plugins run smoothly and avoid memory-related crashes, it’s essential to focus on writing efficient, well-structured code while sticking to iOS-specific best practices. Start by managing memory effectively - this means keeping an eye on object lifecycles and using tools like Xcode Instruments to identify and fix retain cycles that might lead to memory leaks. Another key tip? Don’t bog down the main thread with heavy tasks. Instead, move resource-intensive operations to background threads to keep the app responsive.
On top of that, be diligent about releasing resources - whether it’s files, images, or network connections - once they’re no longer in use. If you’re working with Capacitor for your app, platforms like Capgo can make your life easier by simplifying updates and fixes. This means you can tackle performance issues quickly without waiting for app store approvals. Following these steps will help boost the stability and reliability of your custom iOS plugins. :::
::: faq
How can Xcode’s performance settings and testing tools help optimize custom iOS plugins in Capacitor?
Xcode’s Performance Settings and Testing Tools
When it comes to optimizing custom iOS plugins in Capacitor, Xcode offers some powerful tools to help developers fine-tune their work. One standout feature is Instruments, which lets you track key metrics like memory usage, CPU performance, and energy impact. These insights make it easier to pinpoint and address performance bottlenecks.
Xcode’s debugging tools also play a crucial role, allowing you to test your plugin in real-time on iOS devices. This ensures your code runs efficiently and delivers a smooth experience for users.
For faster updates and streamlined fixes, platforms like Capgo can be a game-changer. They allow you to push live updates directly to users without requiring app store approvals, all while staying within Apple’s guidelines. This approach not only saves time but also keeps your app running at its best. :::