Capgo’s Capacitor plugin is a tool for real-time custom event tracking and instant analytics. It helps developers monitor user behavior and app performance effectively, ensuring a smooth user experience. With 95% of updates delivered within 24 hours and 1.6 trillion updates already served, Capgo is trusted by developers for its speed and reliability.
Key Features:
- Fast Updates: 95% of active users updated within 24 hours.
- Instant Analytics: API response time averages 434ms globally.
- Security: End-to-end encryption ensures data safety.
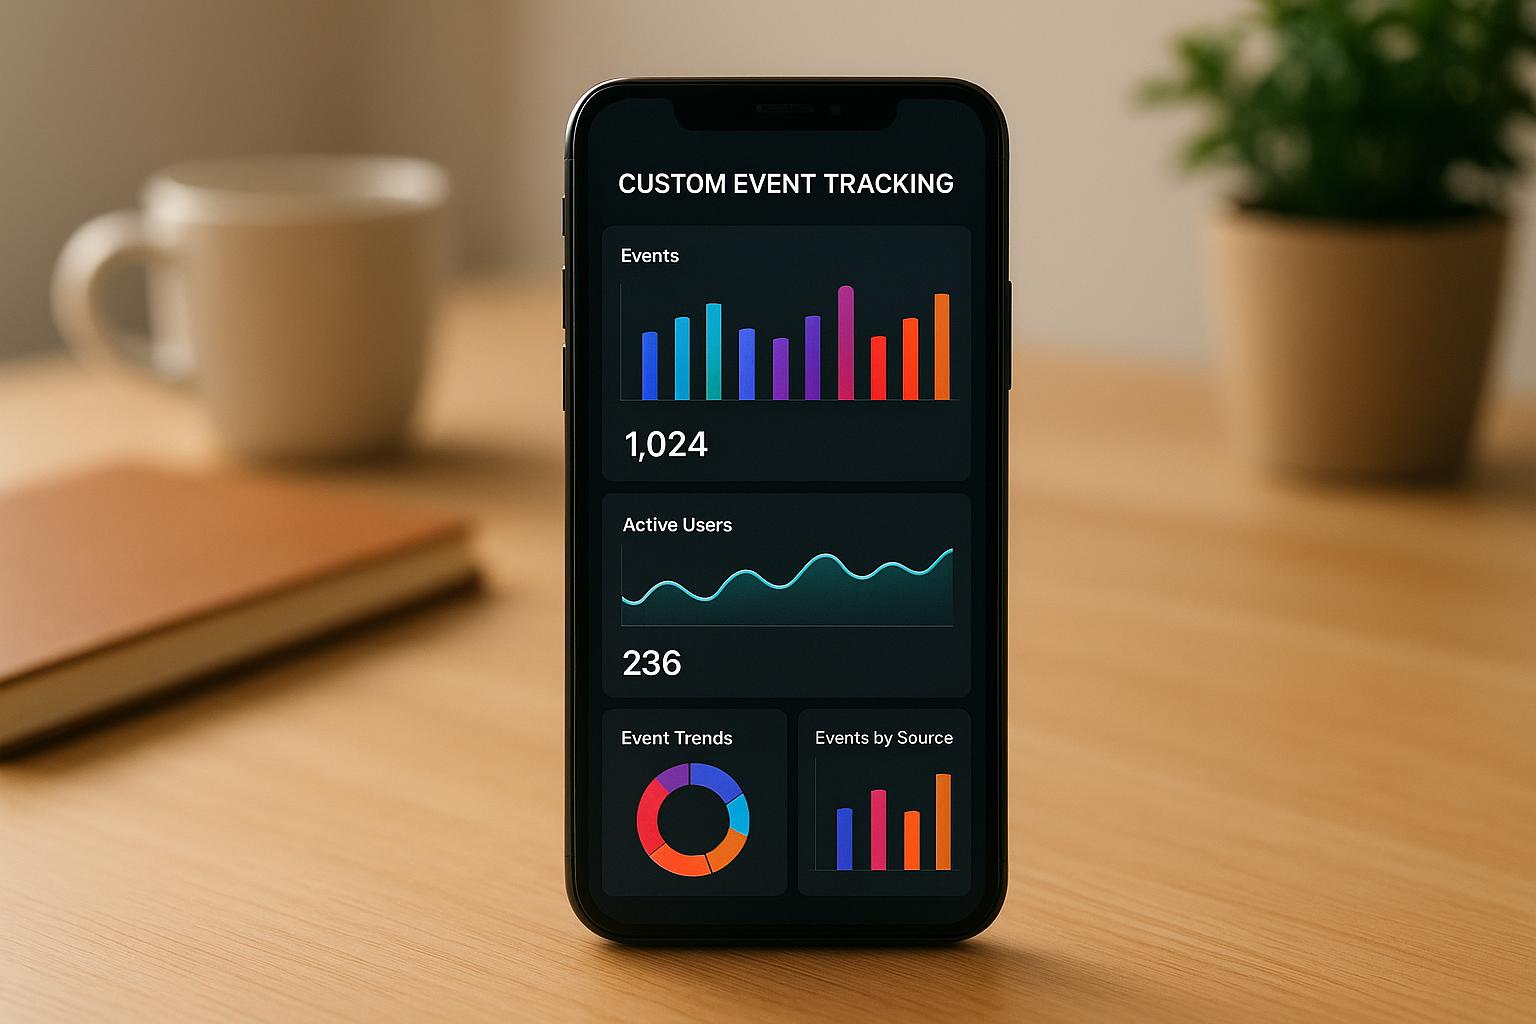
- Custom Event Tracking: Monitor user actions, screen views, and app performance.
Setup Requirements:
- Capacitor: Version 5.0+.
- Node.js: v20.0.0+.
- System Specs: Minimum 8GB RAM, 256GB storage, Intel i5/AMD Ryzen 5 processor.
Installation Steps:
-
Install the plugin:
Terminal window npm install @capgo/capacitor-updater -
Configure your API key:
Terminal window npx @capgo/cli init -
Sync your project:
Terminal window npx cap sync
Why It Matters:
- 79% of users expect instant responses. Capgo helps meet this demand.
- Poor app experiences lead to 80% user abandonment. Real-time tracking can prevent this.
Capgo is already powering 1.7K apps and improving customer satisfaction by 25%. If you’re a developer, this plugin simplifies event tracking while ensuring your app stays fast, secure, and user-friendly.
How to Use Firebase Analytics with Ionic
Setup Requirements
To get started with the Capgo plugin, you’ll need to ensure your system is properly configured to support its functionality.
System Requirements
Make sure your development environment meets the following specifications:
| Component | Minimum Requirement | Recommended |
|---|---|---|
| Capacitor | 5.0+ | Latest stable version |
| Node.js | v20.0.0+ | LTS version |
| System RAM | 8GB | 16GB |
| Storage | 256GB | 512GB SSD |
| Processor | Intel i5/AMD Ryzen 5 | Intel i7/AMD Ryzen 7 |
Platform-Specific Requirements:
-
For iOS Development (macOS only):
-
For Android Development:
- Android Studio Hedgehog (2023.1.1) or newer
- Android SDK API level 23+
- JDK 17
- Gradle 8.0+
Plugin Installation Steps
Once your environment is ready, follow these steps to install and configure the Capgo plugin:
-
Install the Capgo plugin:
Run the following command in your project directory:
Terminal window npm install @capgo/capacitor-updater -
Set up your API key:
Initialize the plugin and configure your API key with:
Terminal window npx @capgo/cli init -
Verify the plugin installation:
Check if the plugin is properly installed by running:
Terminal window npm list @capgo/capacitor-updater
Project Sync
After installing the plugin, synchronize your project with the native platforms. This step ensures everything is aligned and up to date. The sync process includes:
| Task | Purpose |
|---|---|
| Web Asset Transfer | Updates native platforms with the latest web assets |
| Config Updates | Adjusts platform-specific configuration files |
| Dependency Installation | Installs all required native dependencies |
To perform the sync, execute the following command:
npx cap syncCustom Event Setup
The Capgo plugin offers a reliable way to track custom events, helping you monitor user actions and app performance effectively.
Event Structure
Every event you track is made up of two main parts:
| Component | Description | Example |
|---|---|---|
| Event Name | A short, descriptive identifier (max 40 characters) | user_subscription_started |
| Event Parameters | Key-value pairs providing additional context | {plan_type: "solo", price: 12} |
Tips for naming your events:
- Always start with a letter.
- Use
snake_caseand maintain case sensitivity. - Keep names short but meaningful.
- Avoid using reserved keywords.
Once you’ve defined your event format, you can start logging events using the methods below.
Event Logging Methods
To track events, use the logEvent method. Here’s how to log basic events and transactions:
await CapacitorUpdater.logEvent({  name: "feature_accessed",  data: {    feature_name: "live_updates",    access_time: Date.now()  }});
await CapacitorUpdater.logEvent({  name: "purchase_completed",  data: {    plan: "MAKER",    amount: 33.00,    currency: "USD",    subscription_period: "annual"  }});
Screen Tracking
You can also track screen views to gain insights into how users navigate through your app:
await CapacitorUpdater.logScreenView({ screen_name: "settings_page", screen_class: "SettingsComponent", parameters: { source: "main_menu", user_type: "admin" }});Best practices for screen tracking:
- Stick to consistent naming conventions across platforms.
- Add relevant context parameters for better insights.
- Track both entry and exit times for screens.
- Use this data to analyze user navigation patterns effectively.
Monitoring and Testing
Capgo offers tools to monitor custom events and troubleshoot implementation issues in real-time, making it easier to ensure your app runs smoothly.
Debug Tools
Keep track of your event streams with these debugging options:
Using the Capgo CLI Debug Command:
npx @capgo/cli@latest app debugThis command gives you a live view of your event tracking, showing event names, parameters, and transmission status as they happen.
For more advanced debugging, you can rely on platform-specific tools:
| Platform | Debug Tool | Purpose |
|---|---|---|
| iOS | Xcode + LLDB | Inspect native code, analyze memory usage |
| Android | Android Studio + Logcat | Log events in real-time, profile performance |
| Web | Chrome DevTools/Safari Inspector | Debug JavaScript, monitor network requests |
If you need even more detailed logs, you can enable verbose logging with this command:
npx cap run ios --verboseOnce you’ve confirmed your event flow is working as expected, it’s time to fine-tune data transfer settings for better performance.
Data Transfer Settings
After verifying your events using debugging tools, you can optimize data transfer settings to ensure smooth and efficient performance. For example, Capgo’s CDN can transfer a 5MB bundle in just 114ms, with an API response time of 434ms.
Security Configuration Example:
await CapacitorUpdater.configure({ encryption: true, compressionLevel: "high", retryAttempts: 3, batchSize: 50});For apps handling a high volume of data, consider these best practices:
- Use batch processing to minimize overhead.
- Implement retry logic with exponential backoff to handle network issues.
- Apply compression to reduce the size of large payloads.
To keep your data secure while maintaining speed, Capgo includes built-in validation checks and encryption protocols. These features ensure your event tracking remains both reliable and efficient.
Advanced Configuration
User Properties
With the Capgo plugin, you can set up persistent user properties to monitor user behavior effectively across sessions. Here’s an example:
await CapgoPlugin.setUserProperties({ subscriptionTier: "premium", deviceType: "mobile", region: "US-West", lastLoginDate: new Date().toISOString()});For enterprise-level apps, you might want to include additional role-based details, such as user roles and permissions, to refine user segmentation. Once configured, ensure sensitive user data is protected by implementing strong privacy measures.
Data Privacy Settings
Privacy compliance is critical, especially with regulations like GDPR and CCPA. The Capgo plugin simplifies this with built-in privacy controls:
await CapgoPlugin.configurePrivacy({ dataRetention: 90, // Days to retain event data piiEncryption: true, gdprCompliance: true, dataMinimization: true});Best practices for privacy management:
| Privacy Feature | Implementation | Impact |
|---|---|---|
| Data Encryption | End-to-end encryption | Keeps data secure during transfer and storage |
| User Consent | Opt-in mechanisms | Aligns with legal privacy requirements |
| Data Retention | 90-day default policy | Reduces storage of unnecessary data |
| Access Control | Role-based permissions | Limits access to sensitive information |
Performance Settings
Once privacy is secured, it’s time to fine-tune performance for efficient tracking. Use the following configuration to optimize resource usage:
await CapgoPlugin.configurePerformance({ batchSize: 50, batchInterval: 30000, // milliseconds retryStrategy: { maxAttempts: 3, backoffMultiplier: 1.5 }, compressionThreshold: 1024 // bytes});For environments with unreliable network connections, adaptive batching can help:
await CapgoPlugin.setNetworkPolicy({ lowBandwidthMode: true, maxPayloadSize: 100000, // bytes priorityEvents: ["purchase", "error", "crash"]});These settings ensure a balance between real-time tracking and efficient resource management, even under challenging network conditions.
Summary
The Capgo plugin stands out for its ability to provide real-time monitoring and quick user feedback, making it a powerful tool for custom event tracking and advanced configurations. By offering real-time analytics, it simplifies the process of tracking custom events, allowing developers to stay on top of app performance and update deployments.
With an impressive reach - up to 95% of active users receiving updates within 24 hours [1] - the plugin delivers key insights through the following metrics:
| Metric Type | Tracking Capability | Business Impact |
|---|---|---|
| Update Delivery | Real-time installation monitoring | Ensures fast feature rollouts |
| User Engagement | Custom event tracking | Supports data-informed decision-making |
| Error Detection | Proactive issue identification | Reduces potential disruptions |
| Performance Analysis | Bandwidth and resource usage | Improves app efficiency |
These metrics highlight the plugin’s role in simplifying app updates and improving the overall user experience. Its combination of advanced configuration options, privacy controls, and real-time analytics empowers developers to anticipate and resolve issues before they affect users [1].
When setting up custom event tracking, prioritize the following:
- Data Privacy: Take advantage of built-in encryption and compliance tools.
- User Property Tracking: Use persistent properties to analyze user behavior effectively.
- Real-Time Monitoring: Gain immediate insights into updates and installations.
FAQs
::: faq
How does the Capgo plugin protect user data and comply with privacy regulations like GDPR?
Capgo places a strong emphasis on data privacy and adherence to regulations like GDPR. By utilizing end-to-end encryption, the platform ensures that user data remains secure during transmission. It also requires users to provide explicit consent before any data is collected, giving them full control over how their information is managed.
To reinforce its commitment to privacy, Capgo conducts regular evaluations to identify and address potential risks. This proactive approach aligns with the strict data protection standards set by the European Union, helping to protect user trust while staying fully compliant with privacy laws. :::
::: faq
How can I improve event tracking performance with the Capgo plugin?
To get better results with event tracking using the Capgo plugin, try a few smart approaches. First, focus on minimizing the size of the data you send. Break down large datasets into smaller, manageable pieces and compress them. This not only speeds up the process but also helps reduce memory consumption.
Another tip: use caching for data that’s accessed frequently. This can make a noticeable difference in performance. On top of that, tools like Firebase and Sentry are great for keeping an eye on app performance, resource usage, and response times. These tools give you real-time insights, allowing you to make quick adjustments and keep your Capacitor app running smoothly.
By using these strategies, you can improve event tracking performance without compromising the user experience. :::
::: faq
How can I troubleshoot and resolve issues with custom event tracking using Capgo tools?
To address custom event tracking issues in your Capacitor app, several tools and strategies from Capgo can come in handy. Start by using web debugging tools like Chrome DevTools or Safari Web Inspector. These are great for inspecting API calls, tracking resource loading, and identifying JavaScript errors. For native components, rely on platform-specific tools such as Xcode for iOS or Android Studio for Android to dig deeper into potential problems.
Running key Capacitor CLI commands is another effective approach. For example, npx cap doctor helps diagnose configuration issues, while npx cap sync ensures plugins are correctly integrated into your project.
For a more robust debugging process, you might also integrate error tracking platforms like Sentry or LogRocket. These tools monitor real-time errors and user interactions, making them especially useful during over-the-air (OTA) updates. By combining these methods, you can streamline the debugging process and improve the performance of your custom event tracking. :::