Vous envoyez un correctif, regardez CI passer à l'orange, et attendez que la file d'attente de support se calme. Au lieu de cela, les utilisateurs signalent toujours le bug ancien. Certains appareils mettent à jour à la prochaine mise à jour. D'autres restent en arrière. Quelques utilisateurs ouvrent l'application dans un réseau mobile faible et semblent ne jamais attraper le correctif du tout.
Cette lacune entre « nous avons publié la correction » et « l'utilisateur l'a reçue » est là la latence de réseau commence à compter. Pour les équipes qui construisent avec CapacitorJS, Ionic ou Electron, la latence n'est pas un sujet de réseau abstrait. Elle se manifeste par des réponses API lentes, des chargements d'actifs retardés, des mises à jour en direct bloquées et des utilisateurs qui utilisent des versions anciennes code plus longtemps qu'elles ne le devraient.
La plupart des explications sur ce qu'est la latence de réseau s'arrêtent aux pages web ou aux jeux. Cela manque ce que les équipes mobiles rencontrent chaque jour. Dans les applications hybrides, la latence affecte non seulement ce que voit l'utilisateur sur l'écran, mais aussi la rapidité avec laquelle votre système d'actualisation peut livrer du JavaScript, du CSS, de la configuration et des actifs lorsque quelque chose se brise en production.
Table des matières
- Pourquoi mon application se sent-elle si lente ?
- Démanteler la latence de réseau : le concept de base
- Les quatre causes techniques de la latence élevée
- Latence, Jitter et Débit Expliqués
- Impact Réel sur les Applications Mobiles et les Mises à Jour en Ligne
- Comment Mesurer et Diagnostiquer les Problèmes de Latence
- Stratégies Pratiques pour Réduire et Surveiller la Latence
Pourquoi mon application se sent-elle si lente
Un schéma de défaillance courant ressemble à ceci. L'application fonctionne dans le bureau et dans les tests locaux. Ensuite, un problème de production apparaît, vous envoyez une mise à jour en ligne, et les utilisateurs sur le terrain voient toujours le comportement endommagé longtemps après que le correctif est disponible.
À ce moment-là, le problème n'est souvent pas votre JavaScript. C'est le chemin de réseau entre l'appareil et le serveur qui doit livrer la mise à jour. Une latence élevée signifie que chaque requête prend plus de temps pour commencer et plus de temps pour se terminerPar conséquent, même les petites vérifications de mise à jour peuvent paraître peu fiables lorsqu'il y a une instabilité de connexion.
Pour la livraison OTA, ce retard compte plus que de nombreux équipes ne le pensent. Une latence élevée supérieure à 100ms peut retarder la transmission du bundle et étirer les temps d'attente de la prochaine mise à jour de quelques minutes à plusieurs heures sur des connexions médiocres, et les réseaux mobiles dans les marchés émergents comme l'Inde et le Brésil peuvent atteindre 80-120ms RTT pendant les heures de pointe selon Vue d'ensemble de la latence de réseau de MeterSi votre processus de mise en production suppose une connexion propre et rapide, les utilisateurs réels briseront rapidement cette hypothèse.
Les mises à jour lentes ne proviennent pas toujours de gros bundles. Parfois, la mise à jour est petite, mais les aller-retours sont coûteux.
That’s why developers ask “why does my app feel so slow” even when bandwidth looks fine. The app may not be downloading much data. It may instead be waiting too long at each step: opening a connection, requesting metadata, checking version state, pulling changed files, and confirming integrity.
Pour les équipes mobiles, cela change l'approche de débogage des incidents. Ne vous contentez pas de « le serveur est en ligne » ou « le package est petit ». Considérez plutôt une question plus opérationnelle : combien de temps faut-il à un appareil sur un réseau réel pour demander la mise à jour, recevoir le premier octet et terminer la transaction sans réessais ? C'est là que se trouve généralement la réponse.
Déballage de la latence réseau Le concept clé
La latence réseau est le temps qu'il faut pour que les données voyagent d'un client à un serveur et retour. Ce trajet en boucle est généralement mesuré en Temps de trajet en boucle, ou TTB, et pour les équipes d'applications, cela façonne directement la vitesse à laquelle le produit se sent dans la main de l'utilisateur.
Une requête peut être minuscule et encore se sentir lente. C'est là que les équipes ont souvent tendance à se tromper.
Le TTB mesure le retard dans la conversation entre appareil et serveur, et non la taille du payload transféré.
Elle est généralement mesurée en millisecondes, car les interactions mobiles sont sensibles à des retards très courts.

La latence est un retard. La bande passante est une capacité
Ces termes se mélangent constamment lors de la débogage d'applications, et ils conduisent les équipes vers la mauvaise solution.
La bande passante décrit la quantité de données que la connexion peut transporter sur le temps. La latence décrit le temps qu'il faut pour démarrer et terminer une échange individuel. La congestion ajoute de l'attente lorsque trop de flux concurrents se disputent le même chemin. Le jitter apparaît lorsque ce retard change d'une requête à la suivante.
Cela compte dans les produits réels. Un appareil peut se trouver sur une connexion avec beaucoup de bande passante et se sentir lent si chaque requête a une longue attente avant que le premier byte utile n'arrive. Je vois cela souvent dans les stacks hybrides de mobiles et les runtimes de bureau tels que CapacitorJS et Electron, où le démarrage dépend souvent de plusieurs petites appels réseau plutôt qu'un grand transfert.
Pourquoi les équipes d'applications devraient-elles s'intéresser à RTT
Les utilisateurs ne voient pas les graphiques de débit. Ils expérimentent les pauses entre les actions et les résultats visibles.
Dans une application mobile, une seule page peut dépendre de l'état d'authentification, de la configuration à distance, des données API, des images, des poignées de main d'analytique et d'une vérification de l'actualité. Dans un flux d'actualisation en direct, le dispositif peut également avoir besoin de valider les métadonnées de version, de demander des actifs modifiés et de confirmer l'intégrité avant que le nouveau bundle soit prêt. Chaque aller-retour ajoute des attentes, surtout lorsque ces étapes se produisent en séquence.
La livraison à l'égout change cette équation. Si les manifestes d'actualisation, les bundles ou les réponses API sont servis plus près du dispositif, RTT chute avant que toute optimisation du payload ne commence même. Pour les équipes qui livrent des mises à jour en direct pour les applications CapacitorJS et Electron, cela est souvent plus utile que de raser quelques kilobytes d'un fichier dont les utilisateurs attendent encore trop longtemps pour le demander.
Règle pratique : Les fonctionnalités construites sur plusieurs requêtes séquentielles ressentent la latence en premier, la bande passante en second.
C'est pourquoi une application peut paraître en bonne santé dans les tableaux de bord d'infrastructure et encore sentir lente aux utilisateurs. Le backend peut être disponible, les payloads peuvent être petits et les octets totaux peuvent être modestes. Si la conversation réseau commence tard à chaque étape, le produit ressent toujours la lenteur.
Les Quatre Causes Techniques de Haute Latence
La haute latence est rarement une chose unique. Dans les applications mobiles, en particulier celles qui livrent des mises à jour en direct à CapacitorJS et Electron clients, le retard vient généralement de quatre points séparés le long du chemin de requête. Identifier lequel domine économise beaucoup de réglages inutiles.

Délai de propagation
Le délai de propagation est un temps de voyage pur. Le paquet doit encore traverser la distance physique à travers les antennes cellulaires, les fibres, les échanges de peering et les réseaux régionaux avant que quoi que ce soit d'utilisable ne se produise.
Cela compte plus sur les appareils mobiles que beaucoup d'équipes ne le pensent. Un téléphone sur 5G à Madrid appelant un origine dans us-east peut avoir une connexion radio saine et encore sentir lente parce que chaque vérification de manifeste, chaque actualisation d'authentification ou chaque appel API commence loin de l'utilisateur. Dans les systèmes de mise à jour en direct, cette distance se manifeste avant même le téléchargement du bundle commence.
Délai de transmission
Le délai de transmission est le temps nécessaire pour mettre les données sur le réseau. La taille des payloads le détermine. La qualité de la connexion le rend pire ou mieux.
Les équipes d'applications créent leurs propres problèmes à ce stade. Les JSON volumineux, les réponses chargées en images, les lots de mise à jour avec trop d'actifs inchangés et les payloads de configuration verbeux augmentent tous le temps avant que le dispositif ait la réponse complète. Sur les liens mobiles faibles, la pénalité est évidente. Un lot de mise à jour qui semble acceptable sur le Wi-Fi de bureau peut devenir un ralentissement visible sur le LTE de la circulation.
Une comparaison simple fonctionne bien en pratique. La propagation est le trajet lui-même. La transmission est le temps passé à charger le camion avant qu'il parte.
Le retard de file d'attente
Le retard de file d'attente se produit lorsque les paquets attendent derrière d'autres paquets. La congestion sur le réseau local, le réseau du transporteur, un fournisseur de transit ou le côté de destination peut ajouter tous des retards qui n'étaient pas présents il y a une minute.
La description de Kentik sur la latence et les performances du réseau est utile ici car elle relie la congestion, le traitement des paquets et les limites de débit. La leçon pratique est claire. Une fois que les liens et les tampons sont occupés, le temps de réponse peut exploser rapidement et de manière incohérente.
Cet modèle se produit dans les rapports d'incident mobiles tout le temps. Un utilisateur ouvre l'application à 8 h 30 le matin dans un train et la vérification de mise à jour traîne. Le même flux semble bien une heure plus tard sur le même appareil. Cela pointe généralement vers une contention réseau, et non une régression de la partie avant.
Le retard de traitement
Les retards de traitement proviennent des appareils et des services qui inspectent, routent, déchiffrent, filtrent ou proxy le trafic avant qu'il n'atteigne votre application. Chaque étape est petite. Le total peut encore devenir notable après suffisamment de sauts.
Les déploiements mobiles d'entreprise sont un exemple courant. Le trafic peut passer par un VPN, un pare-feu web sécurisé, un pare-feu régional, un API gateway, un équilibreur de charge et un maillage de services avant que la demande n'atteigne l'origine. Les applications Electron dans des environnements corporatifs rencontrent souvent le même problème. Le chemin de réseau est techniquement ouvert, mais chaque point de contrôle ajoute du travail.
Lors de la détection, ces quatre causes cartographient généralement à des symptômes visibles :
- Les grandes distances entre le dispositif et l'origine s'adressent à la latence de propagation.
- Les grandes réponses ou les packages d'actualisation s'adressent à la latence de transmission.
- Les ralentissements ou les pointes incohérents en fonction de l'heure s'adressent à la latence de file d'attente.
- Beaucoup d'intermédiaires comme les VPN, les proxies ou les gateways s'adressent à la latence de traitement.
Un utilisateur qui se plaint que l'application est “lente au hasard” pointe souvent vers la variation de la latence de file d'attente et de traitement sur le chemin, et non vers les code modifications sur le dispositif.
Traitons la latence comme un problème de livraison de la voie entière. Cette mentalité conduit à des corrections améliorées pour les API mobiles, les manifestes de mise à jour en temps réel et les actifs servis par l'edge plutôt que de se concentrer uniquement sur le serveur d'application.
Latence, Jitter et Débit Expliqués
La latence, le jitter et le débit décrivent différents modes de panne. Les équipes les combinent souvent en un diagnostic générique « le réseau est lent », puis passent du temps à corriger la bande passante alors que le problème sous-jacent est la variation de retard ou le temps de démarrage des requêtes.
| Métrique | Ce qu'elle mesure | Analogie (Pompe d'eau) | Impact |
|---|---|---|---|
| Latence | Temps qu'il faut à une requête pour aller et revenir | Temps qu'il faut à l'eau pour atteindre le robinet après avoir ouvert le robinet | Réponses lentes, interactions retardées, vérifications d'actualisation paresseuses |
| Jitter | How much that delay varies over time | L'eau arrive en impulsions inégales au lieu d'un flux continu | Un comportement incohérent, des sessions temps réel hachées, un timing des requêtes peu fiable |
| Le débit | How much data moves across the connection over time | How much water the pipe can deliver overall | Les transferts importants se font plus rapidement lorsque le chemin est sain |
Pourquoi ces termes se mélangent
Une connexion peut montrer un débit fort et faire pourtant qu'une application se sente lente. Le chemin transporte beaucoup de données après le transfert commence, mais chaque requête attend trop longtemps pour commencer. Dans les applications mobiles, ce retard apparaît avant que les utilisateurs voient le contenu. Dans les systèmes de mise à jour en temps réel, il apparaît avant que le manifeste soit même récupéré.
Le jitter rend le diagnostic plus difficile car les moyennes le masquent. Un tableau de bord peut signaler une latence moyenne acceptable tandis que les utilisateurs réels voient des temps de réponse inégaux pour des actions identiques. Un appareil reçoit la configuration instantanément. Un autre attend suffisamment longtemps pour que l'état de chargement devienne visible. Ce modèle est courant sur les réseaux cellulaires, les Wi-Fi des commutateurs et tout chemin où la congestion change minute par minute.
Comment un seul indicateur peut sembler sain tandis que l'autre échoue
Pour les API des applications mobiles, la latence domine généralement les petites requêtes. Pour les téléchargements de bundles ou d'éléments, le débit compte plus après que le premier octet arrive. Le jitter détermine si l'expérience semble stable ou aléatoire.
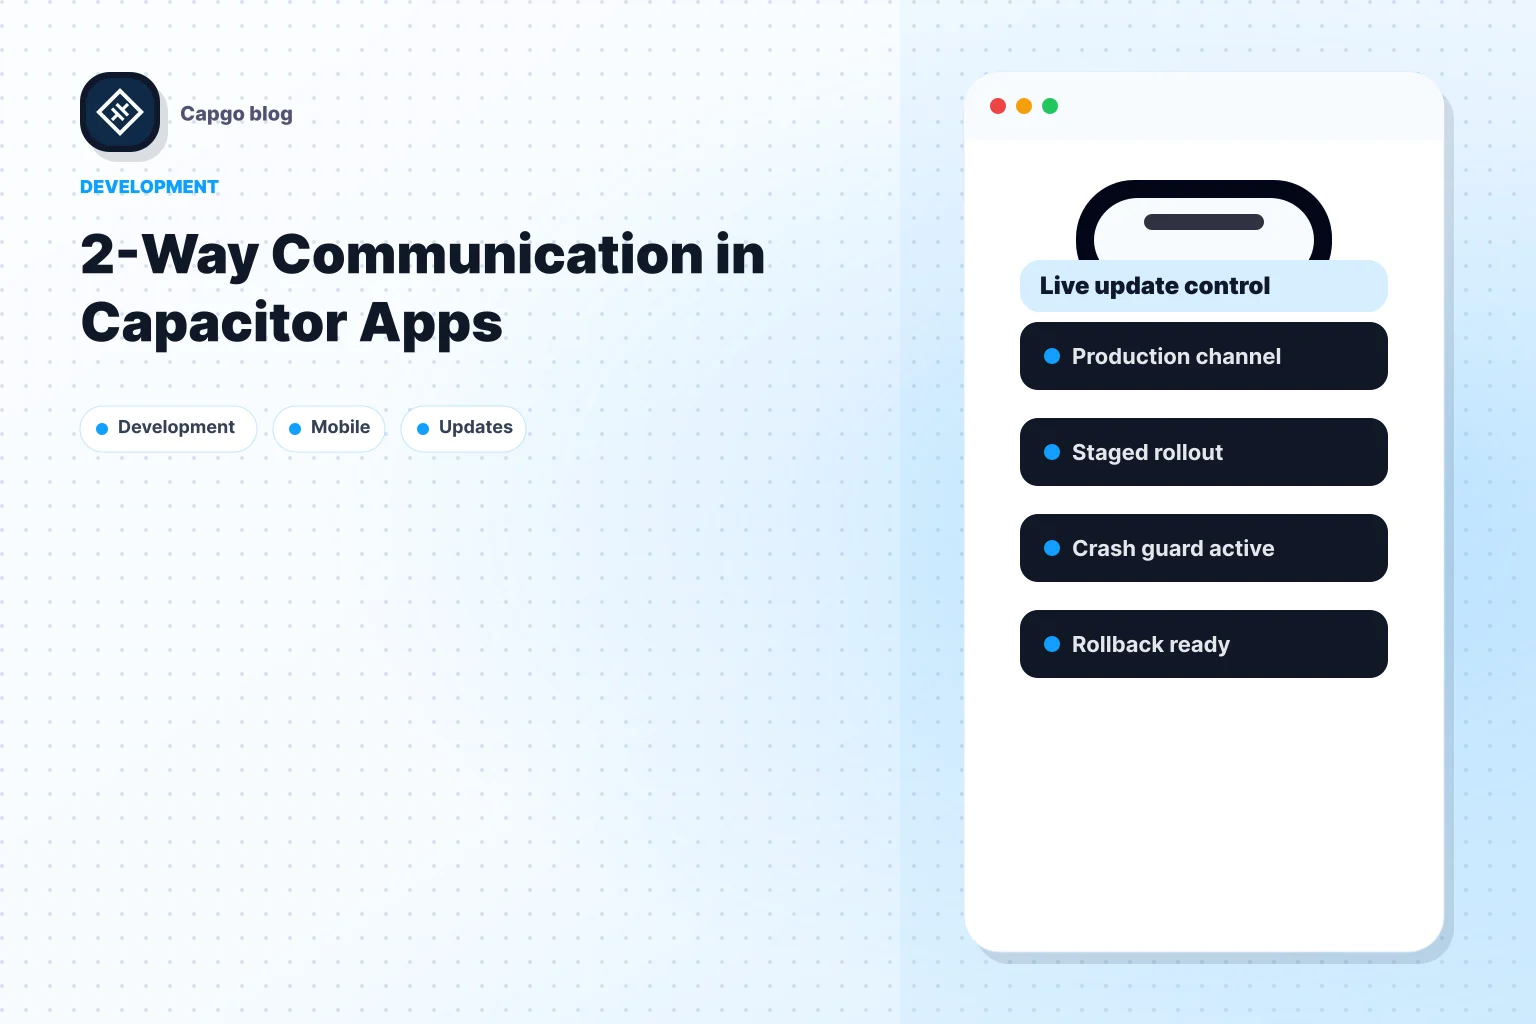
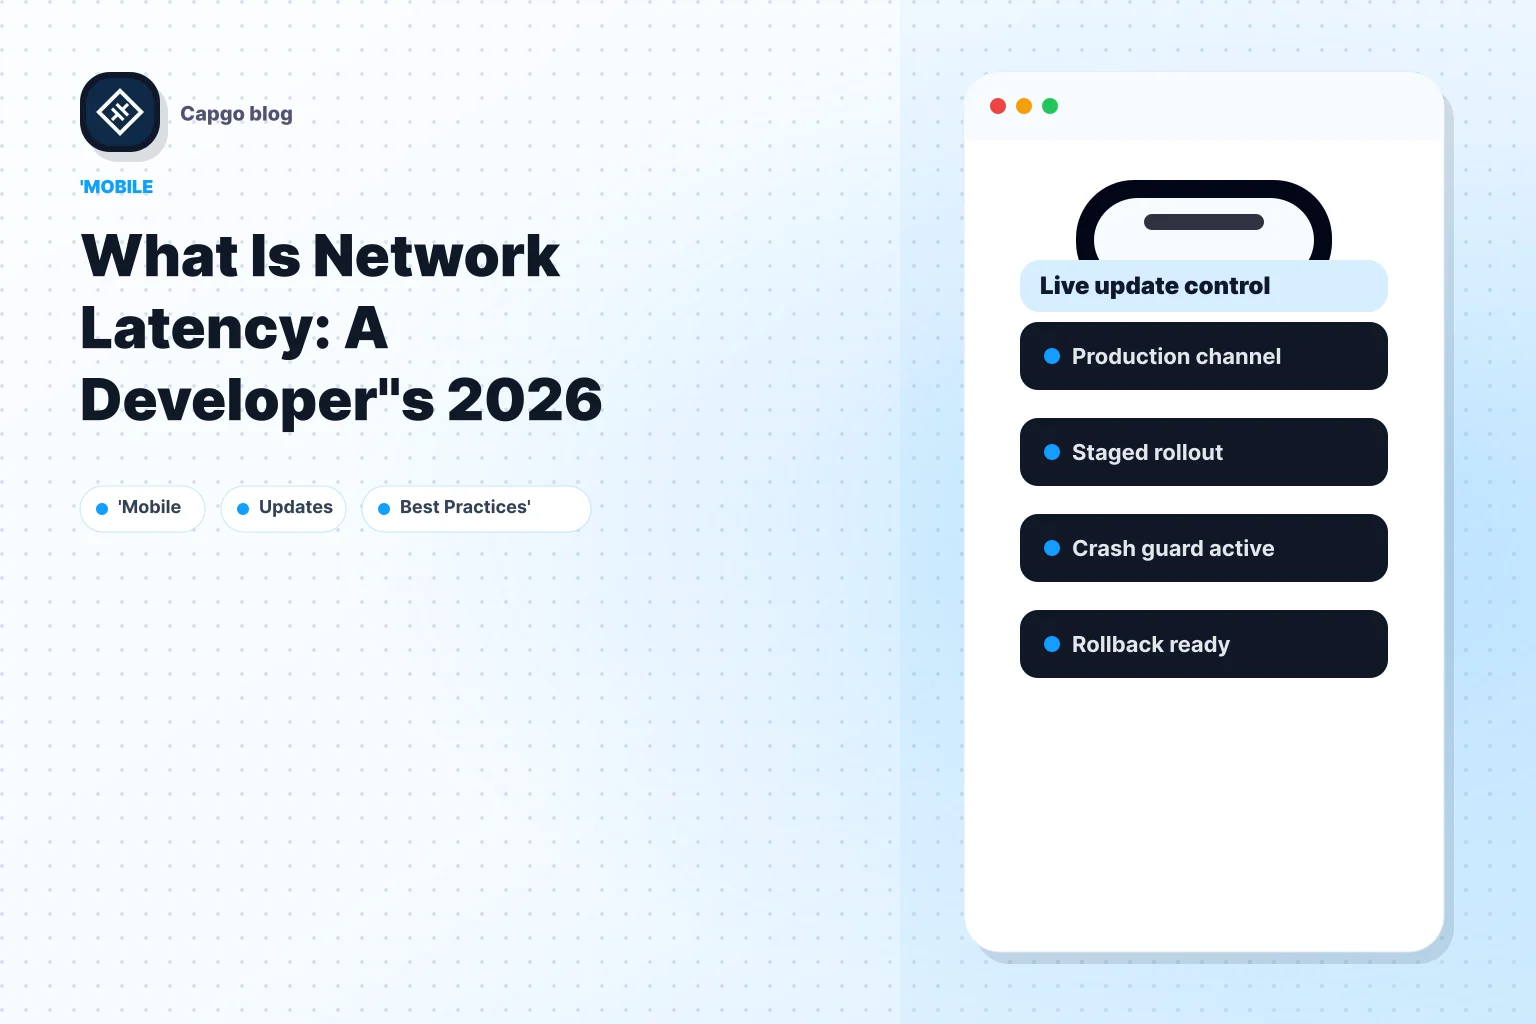
A Capacitor ou flux de mise à jour en temps réel Electron est un bon exemple. Le client vérifie un manifeste, valide des métadonnées et télécharge ensuite un package si nécessaire. Vous pouvez voir les mécanismes dans cette vue d'ensemble de comment les mises à jour en temps réel pour les applications Capacitor fonctionnent. Si la latence est élevée, le contrôle de mise à jour commence tard. Si le bruit est élevé, la synchronisation de la mise à jour devient incohérente entre les appareils. Si le débit est bas, le téléchargement du package ralentit même après l'établissement de la connexion.
Cette distinction est importante lors de la réponse à une incident.
J'ai vu des équipes réagir aux mises à jour lentes en accusant la taille du package en premier. C'est parfois correct, surtout avec de grands bundles JavaScript ou des sorties riches en ressources. Mais pour de nombreux flux mobiles chargés en requêtes, le problème plus important est les itinéraires de requête répétés sur un chemin lointain ou instable. Augmenter la bande passante disponible ne fait rien si chaque handshake, requête de manifeste et appel API commence tard.
La règle pratique est simple : la latence affecte la réactivité, le bruit affecte la prévisibilité et le débit affecte la vitesse de transfert à grande échelle. Si une écran attend de nombreuses petites requêtes, réduisez la latence. Si le comportement change d'une requête à l'autre, investigatez le bruit. Si une mise à jour importante prend trop de temps après le début du téléchargement, investigatez le débit.
Impact réel sur les applications mobiles et les mises à jour en temps réel
A l'utilisateur ouvre l'application après que vous avez expédié une correction il y a une heure. L'authentification s'arrête, l'écran d'accueil se remplit pièce par pièce et le bug qu'ils ont signalé hier est toujours là. Du côté de l'utilisateur, la mise à jour a échoué. Dans de nombreux stacks mobiles, la latence est la raison.

Ce que les utilisateurs ressentent réellement
La latence mobile se manifeste par une hésitation. Un clic ne fait rien pendant une seconde. Une liste affiche son enveloppe, puis attend les données de compte, les drapeaux de fonctionnalité et les images. Un flux d'authentification semble incohérent car chaque étape dépend de la dernière qui a terminé en premier.
Les applications hybrides rendent cela plus visible car elles mélangent souvent le chargement d'actifs web avec les attentes d'applications natives. L'équipe peut tester sur un Wi-Fi rapide dans un bureau et des appareils récents, puis expédier à des utilisateurs dans des trains, des ascenseurs, des réseaux d'hôtels ou des routes de transporteurs surchargés. La même version peut sembler éclatante dans une ville et lente dans une autre.
Les points de failure courants sont prévisibles :
- Les écrans API se sentent lents lorsque l'interface attend plusieurs petites appels avant de pouvoir afficher du contenu utile.
- La configuration à distance, les drapeaux et les actifs arrivent en retard, ce qui retarderait la première peinture significative ou provoquerait des déplacements de mise en page visibles.
- L'authentification et la mise à jour de session se rompent sous le retard car l'échange de jetons, la récupération de profil et les vérifications de permissions se produisent souvent en séquence.
- Vérifications de mise à jour en arrière-plan se terminent trop tard, les utilisateurs rouvrent donc l'application avec une version obsolète de code même si la correction est déjà publiée.
Je conseille généralement aux équipes de surveiller les tickets de support et l'adoption de la mise à jour ensemble. Si les tickets restent élevés après un correctif chaud, le problème est souvent le temps de livraison et non la qualité de code.
Pourquoi les mises à jour en temps réel sont particulièrement sensibles
Les mises à jour en temps réel transforment la latence en un problème opérationnel. Chaque round-trip supplémentaire élargit l'écart entre « correction déployée » et « correction exécutée sur le dispositif ».
Cet écart compte plus sur les appareils mobiles qu'à une site web typique. Une requête d'image lente est gênante. Une mise à jour de patch lente signifie que le support continue de gérer un problème que l'ingénierie a déjà corrigé, les métriques de produit restent déprimées pendant une autre journée et les utilisateurs perdent confiance car l'application se comporte toujours comme la version ancienne.
Pour les équipes de Capacitor , le chemin de mise à jour est direct mais sans pitié. L'aperçu de Capgo sur comment les mises à jour en temps réel pour les applications Capacitor fonctionnent passent en revue la séquence : vérifier, télécharger, valider, appliquer. Chacun de ces étapes n'est pas dramatique en soi. Ensemble, ils créent suffisamment de temps d'attente pour faire passer la correction au-delà de la prochaine fenêtre de lancement, surtout sur les réseaux cellulaires ou pour les utilisateurs éloignés de votre origine.
Les applications Electron rencontrent un problème similaire, mais avec une attente utilisateur différente. Les utilisateurs de bureau s'attendent à ce que les mises à jour arrivent de manière efficace et rapidement. Si l'application vérifie trop lentement, télécharge depuis une région lointaine ou réessaye sur une route instable, le pipeline de mise à jour semble peu fiable même lorsque le package lui-même est correct.
For cette raison, les équipes mobiles devraient considérer la latence comme à la fois un indicateur d'expérience utilisateur et un indicateur de mise à jour. Elle affecte la vitesse à laquelle les écrans réagissent, la rapidité avec laquelle la configuration à distance prend effet, et la durée pendant laquelle les bogues connus restent actifs sur le terrain.
Si vous avez besoin d'une base de référence simple pour discuter de la latence avec le support ou la QA, partagez un guide en langage clair sur comment vérifier le temps de trajet aller-retour. Cela aide à aligner la conversation autour d'un retard mesurable au lieu de rapports vagues selon lesquels l'application est “lente.”
La livraison à l'edge change le résultat ici. Le service de manifestes, de bundles et de métadonnées d'actualisation proche de l'utilisateur réduit le temps d'attente avant que l'application puisse effectuer du travail utile. Pour les systèmes d'actualisation en temps réel, cela a souvent plus d'impact que de serrer un peu plus de bande passante à partir de la connexion, car le premier problème est généralement la distance et le coût de démarrage des requêtes répétées, et non la vitesse de transfert brute seule.
Comment Mesurer et Diagnostiquer les Problèmes de Latence
Les problèmes de latence deviennent gérables une fois que vous arrêtez de deviner et que vous commencez à mesurer le chemin. Vous n'avez pas besoin d'une plateforme d'observabilité complète pour obtenir les premières réponses utiles.
Commencez par le ping et le traceroute
Utilisez ping en premier. Cela vous donne une mesure simple du RTT entre votre machine et un destinataire. Cela ne vous expliquera pas tout, mais cela vous dit rapidement si le chemin est calme ou clairement malade.
Ensuite utilisez traceroute (ou tracert sur Windows). Cela montre la séquence de sauts entre le client et le serveur. Ce que vous cherchez, ce n'est pas un grand nombre final. Vous voulez savoir où le retard commence à augmenter.
Un modèle de lecture pratique ressemble à ceci :
- Des temps bas stables à travers les sauts signifient généralement que le chemin est sain.
- Un saut soudain à un saut peut indiquer la congestion, l'inefficacité de la mise en route ou un intermédiaire surchargé.
- Une grande variation à travers les exécutions répétées suggère du bruit ou des conditions de file d'attente changeantes.
- Un chemin inhabituellement long signifie souvent un surcoût de traitement et de surcharge de mise en route.
Si vous souhaitez une étape par étape pour interpréter les tests de temps de trajet, Cloudflare a une guide pratique sur comment vérifier le temps de trajet aller-retour That est utile pour les développeurs juniors et les ingénieurs de support qui ont besoin d'un point de départ partagé.
Utilisez les outils de navigateur pour les actifs d'applications hybrides
Pour les applications Capacitor, les outils de navigateur sont toujours précieux car une grande partie de l'application tourne dans une vue web. Ouvrez les outils de développement et inspectez la Réseau rubrique. La métrique à surveiller de près est le TTFB, ou temps de réponse avant le premier octet.
Le TTFB vous indique combien de temps le client attend avant que les premières données de réponse arrivent. Si le TTFB est constamment élevé, le problème peut impliquer la distance réseau, le temps de réponse du serveur ou les intermédiaires entre le dispositif et le service. Si le TTFB est correct mais que le temps de transfert total est long, la taille du payload est un suspect plus probable.
La surveillance doit connecter le comportement du dispositif aux conditions réseau. Pour les équipes qui construisent cette capacité dans les flux de mise en production, l'écrit de Capgo sur la mise en place de la surveillance de la performance dans Capgo est une référence utile pour instrumenter ce que les utilisateurs expérimentent plutôt que de se fier uniquement aux métriques côté serveur. Lorsque vous avez besoin de diagnostics natifs au-delà des outils de navigateur DevTools, consultez @Capacitor/__CAPGO_KEEP_1__-network-diagnostics Pour les développeurs juniors et les ingénieurs de support qui ont besoin d'un point de départ partagé. Utilisez les outils de navigateur pour les actifs d'applications hybrides : les applications capgo utilisent encore les outils de navigateur car une grande partie de l'application tourne dans une vue web. Ouvrez les outils de développement et inspectez la rubrique Réseau. La métrique à surveiller de près est le TTFB, ou temps de réponse avant le premier octet. Le TTFB vous indique combien de temps le client attend avant que les premières données de réponse arrivent. Si le TTFB est constamment élevé, le problème peut impliquer la distance réseau, le temps de réponse du serveur ou les intermédiaires entre le dispositif et le service. Si le TTFB est correct mais que le temps de transfert total est long, la taille du payload est un suspect plus probable. La surveillance doit connecter le comportement du dispositif aux conditions réseau. Pour les équipes qui construisent cette capacité dans les flux de mise en production, l'écrit de capgo sur la mise en place de la surveillance de la performance dans capgo est une référence utile pour instrumenter ce que les utilisateurs expérimentent plutôt que de se fier uniquement aux métriques côté serveur. Lorsque vous avez besoin de diagnostics natifs au-delà des outils de navigateur DevTools, consultez @capgo/capacitor-network-diagnostics. peut mesurer la disponibilité, la latence et les pertes de paquets à partir du dispositif.
Mesurez chaque fois que possible du côté du client. Les tableaux de bord du serveur peuvent afficher « en bon état » tandis que l'utilisateur attend encore sur un chemin lent que vous ne voyez pas.
La clé est la corrélation. Comparez le temps de réponse, le chemin d'hôte, le temps de réponse de la page, la taille du payload et le comportement de la mise à jour ensemble. Un seul indicateur ne raconte rarement l'histoire complète.
Stratégies pratiques pour réduire et surveiller la latence
Réduire la latence commence par deux priorités : raccourcir le chemin et envoyer moins de donnéesTout le reste est secondaire.

Réduire la distance et le payload en premier
Du côté du réseau, placez le contenu plus près des utilisateurs. Les benchmarks SLA de Verizon dans ses service de latence montre ce que les attentes de niveau entreprise ressemblent : 45ms ou moins pour les trajets régionaux au sein de l'Amérique du Nord et 90ms pour les trajets transatlantiques. Ces nombres sont un puissant rappel que la distance pèse encore sur les performances, et une faible latence régionale est réalisable lorsque le réseau est conçu pour cela.
Pour les équipes d'applications, cela suggère des actions concrètes :
- Utilisez la livraison à l'égout Ainsi, les manifestes et les ensembles de fichiers ne voyagent pas toujours jusqu'à un origine lointaine.
- Conservez les ensembles de fichiers minces Puisque les charges de transmission plus petites réduisent les coûts et se rétablissent mieux sur les liens mobiles faibles.
- Préférez les mises à jour différentielles Lorsque votre mise à jour prend en charge ces fonctionnalités, les appareils récupèrent uniquement les éléments qui ont changé.
- Couper les chaînes de requêtes Dans les flux de démarrage. Moins d'appels séquentiels signifie moins de pénalités de latence.
Une option dans cette catégorie est Capgo's guide pour réduire la latence dans les applications Capacitor, qui se concentre sur la livraison d'actualisations, la distribution à l'égard et les petits paquets Web pour les applications hybrides.
Surveiller le chemin et non seulement l'endpoint
Beaucoup d'équipes surveillent la disponibilité et le temps de réponse moyen, puis manquent la douleur réelle de l'utilisateur. Le dépannage de la latence fonctionne mieux lorsque vous regardez les valeurs aberrantes, les changements de route et les échecs spécifiques aux appareils.
Les habitudes utiles incluent :
- Suivre les temps de chargement côté client pour les vérifications d'actualisation, les récupérations de manifeste et les chargements d'actifs.
- Enregistrer les tentatives d'actualisation échouées ou partielles pour que le support puisse distinguer les problèmes de réseau des défauts de version.
- Comparer les régions séparément car une géographie peut décliner tandis que l'autre semble en bonne santé.
- Examinez attentivement les outils expérimentaux avant de les adopter. Les collections comme Feedback sur l'expérience de l'expérimentation Pinglater AI peuvent aider les équipes à voir comment d'autres évaluent les outils axés sur la latence en pratique. L'échange principal est simple. Plus d'observabilité vous donne une meilleure diagnose, mais cela ajoute également du travail d'implémentation. C'est toujours valable, car deviner la latence est coûteux. La latence mesurée est réparable.
Si votre équipe délivre des applications CapacitorJS ou Electron et a besoin d'une façon contrôlée de livrer des correctifs rapidement sur un réseau de bord mondial édité,
__CAPGO_KEEP_0__ Capgo Prêt avec
Si votre équipe utilise CapacitorJS ou Electron et a besoin d'une façon contrôlée de livrer des correctifs rapidement sur un réseau de bord mondial édité Outrank app
Continuez de L'attente de réseau : Guide 2026 du développeur
Si vous utilisez L'attente de réseau : Guide 2026 du développeur pour planifier la livraison d'actualisation en direct, connectez-le avec Capgo Mises à jour en direct pour le flux de travail du produit dans Capgo Mises à jour en direct, Vue d'ensemble pour le détail d'implémentation dans Vue d'ensemble, Caractéristiques pour le détail d'implémentation dans Caractéristiques, Comportement de mise à jour pour les détails d'implémentation dans Mise à jour du comportement, et Types de Mise à jour pour les détails d'implémentation dans Types de Mise à jour.