Observability is the ability to infer a system’s internal state from external outputs by correlating logs, metrics, and traces. It answers why something failed, not just that it failed.
Your mobile release has just reached production. An alert says the update service is healthy, the API dashboard is green, and the error rate looks normal. Then support reports that users on one device model are stuck on an older bundle, while another group sees a blank screen after launch. You can see the symptoms, but not the path that produced them.
That’s the difference between knowing something broke and being able to explain it. A metric can show that downloads slowed. A trace can reveal whether the delay came from the client, update service, or API. A log can expose the checksum mismatch, rejected bundle, or JavaScript exception that caused the failure.
Modern applications make this context harder to preserve. A Capacitor app may involve native code, a web layer, remote APIs, authentication, analytics, a live-update service, and a particular device or operating-system version. An Electron application adds its own desktop runtime and environment differences. When a release changes quickly, predefined alerts rarely anticipate every failure mode.
Observability gives engineers a way to investigate those unfamiliar situations without guessing. It helps teams diagnose incidents faster, ship changes with clearer evidence, and connect technical behavior to what users experience. The examples below build from the definition and the three classic pillars to practical implementation, business value, and live updates for Capacitor and Electron applications.
Table of Contents
- What Observability Really Means in Software Systems
- The Three Pillars That Make Systems Observable
- Observability Versus Monitoring and How They Work Together
- Why Observability Is Now a Business Capability
- Implementation Patterns Best Practices and Tradeoffs
- Observability in Action for Capacitor Electron and Capgo Live Updates
What Observability Really Means in Software Systems
The word observability began outside software. In the 1960s, Rudolf Kálmán used it in control theory to describe how well an engineer could infer a system’s internal state from its outputs, as documented in this history of observability. The idea later entered software practice through distributed-systems work, including a widely cited 2013 Twitter engineering blog describing an “observability stack.” The three-pillar model of logs, metrics, and traces became standard in 2018, according to the same reference.
A car dashboard offers a useful comparison. The speedometer tells you how fast you’re moving, the fuel gauge shows remaining fuel, and a warning light signals a known condition. That’s useful monitoring. An engine diagnostic system goes further. It combines sensor readings and error records to help explain why the engine is misfiring.
Software observability works in the same way. It doesn’t mean collecting every possible record without purpose. It means producing enough connected evidence that an engineer can infer what the application is doing internally, even when the application is distributed across services, devices, and runtimes.
Why outputs matter in distributed applications
You often can’t pause a production system and step through every line of code. Requests move between components, containers change, users run different versions, and failures may disappear before you reproduce them locally. External outputs become your evidence.
A cloud-native application usually has several interdependent parts, so understanding its architecture provides essential context. A practical guide to cloud-native architecture for SaaS can help teams reason about those dependencies before deciding what to instrument.
For a Capacitor application, useful outputs might include:
- Client events, such as app launch, bundle download, verification, activation, and rollback.
- Performance metrics, such as startup latency, request latency, failed updates, and crash counts.
- Distributed traces, connecting a user action to the app, API gateway, backend service, and database.
- Structured logs, carrying the device, app version, channel, transaction ID, and error context.
The property is correlation. A device identifier or trace ID can connect an update attempt, its download result, and the runtime error that followed. Without that relationship, each dashboard shows only a fragment.
For a mobile-specific perspective, Capgo’s app observability guide explores how application telemetry can support release diagnosis. The broader principle remains simple: observable systems let you ask new questions about behavior using evidence already captured.
The Three Pillars That Make Systems Observable
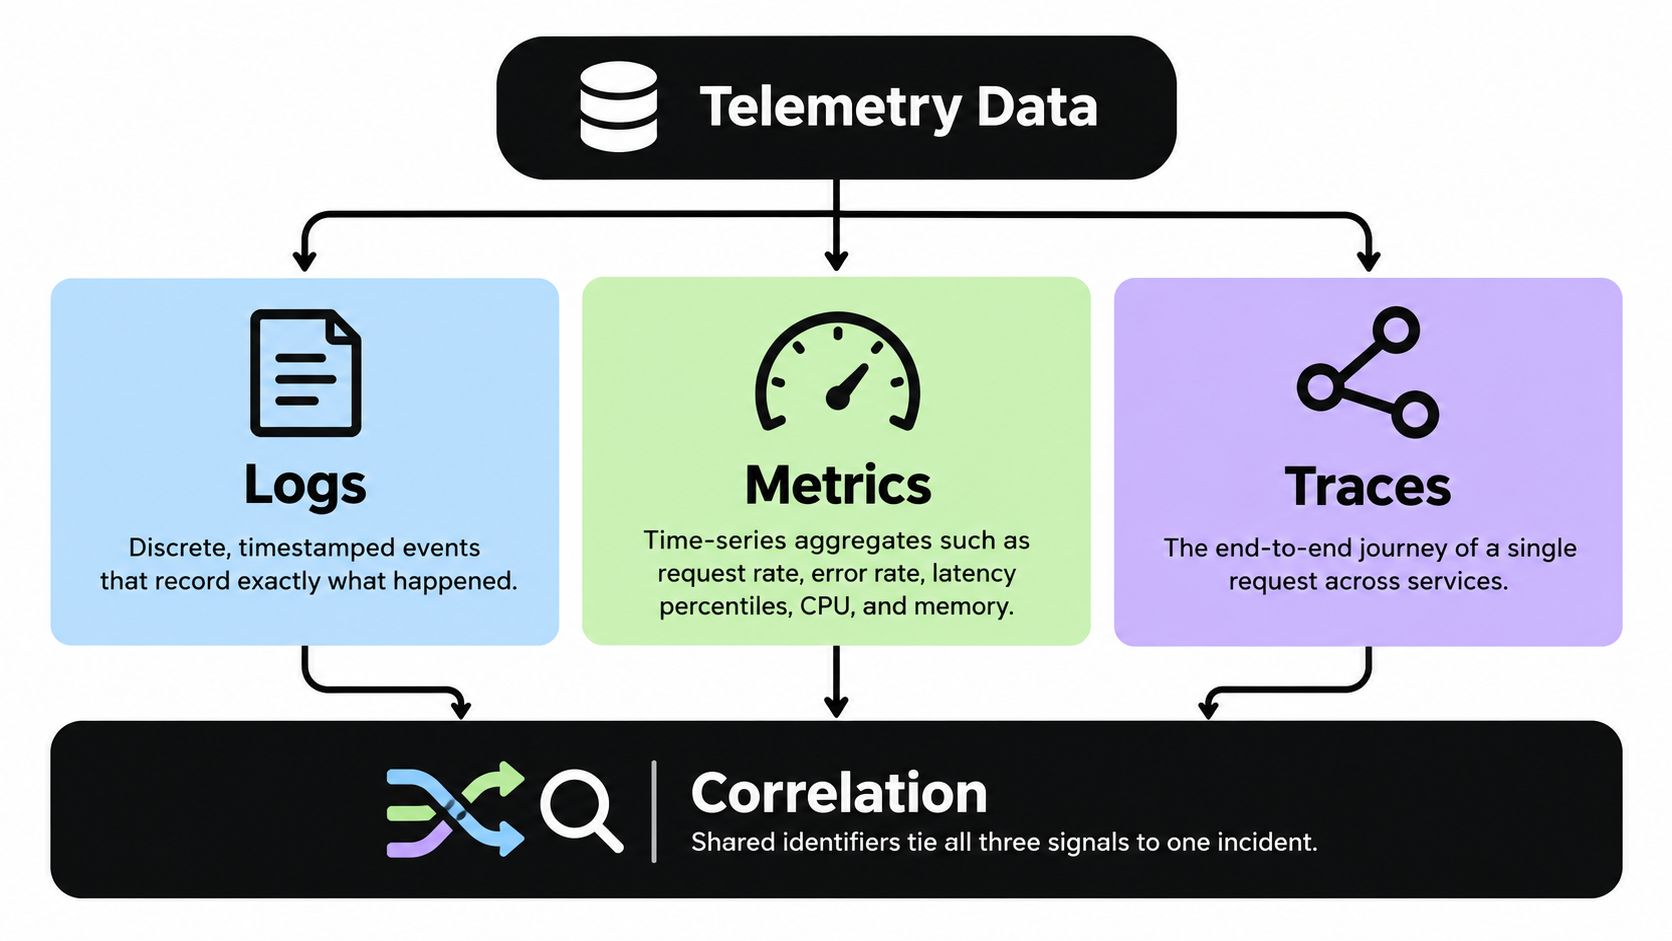
Logs, metrics, and traces have different shapes and answer different questions. Observability becomes useful when engineers correlate them around the same request, release, user journey, or device.
Metrics are time-series aggregates. Examples include request rate, error rate, latency percentiles, CPU, and memory. They compress many events into a value that’s easy to chart and alert on. A metric might tell you that bundle activation failures increased after a deployment, but it won’t identify the exact device or exception.
Traces reconstruct the end-to-end path of a request across services. Each part of that path is represented by a span. If an update request passes through an app, edge service, authentication layer, storage service, and API, the trace shows where time accumulated or where the request failed.
Logs provide event-level detail. They can contain a stack trace, transaction ID, response code, bundle version, or validation result. Logs explain the local circumstances that metrics summarize and traces locate.
Practical rule: Metrics tell you that a problem exists, traces show where it occurs, and logs explain why it occurred.
Consider a live-update failure. A metric reports that update verification errors rose. A trace follows one failed request and shows that the bundle reached the device, but the verification span failed. The matching log records the checksum result and identifies the bundle version. Together, those signals restore the execution context that isolated monitoring can’t provide.
Correlation is the working mechanism
Correlation requires shared identifiers and consistent attributes. A trace ID should travel across service boundaries. Logs should include that ID where possible. Metrics should support dimensions that help engineers narrow the affected release, channel, device family, or application version without producing an unmanageable number of unique time series.
The same approach works on the client side. Suppose a user taps a feature and sees a timeout. The client can record the action and app version, the trace can follow the network request, and the backend log can show whether the request failed at authentication or data retrieval. Engineers don’t need to infer the entire story from a single error message.
Teams working with large log volumes can use structured fields and query tools rather than relying on free-text searching alone. Capgo’s log analysis tools guide provides relevant background for making logs more useful during investigation.
The three pillars aren’t competing products. They form a cause-and-effect chain. Metrics provide the broad signal, traces reduce the search area, and logs supply the detailed evidence needed for a fix.
Observability Versus Monitoring and How They Work Together
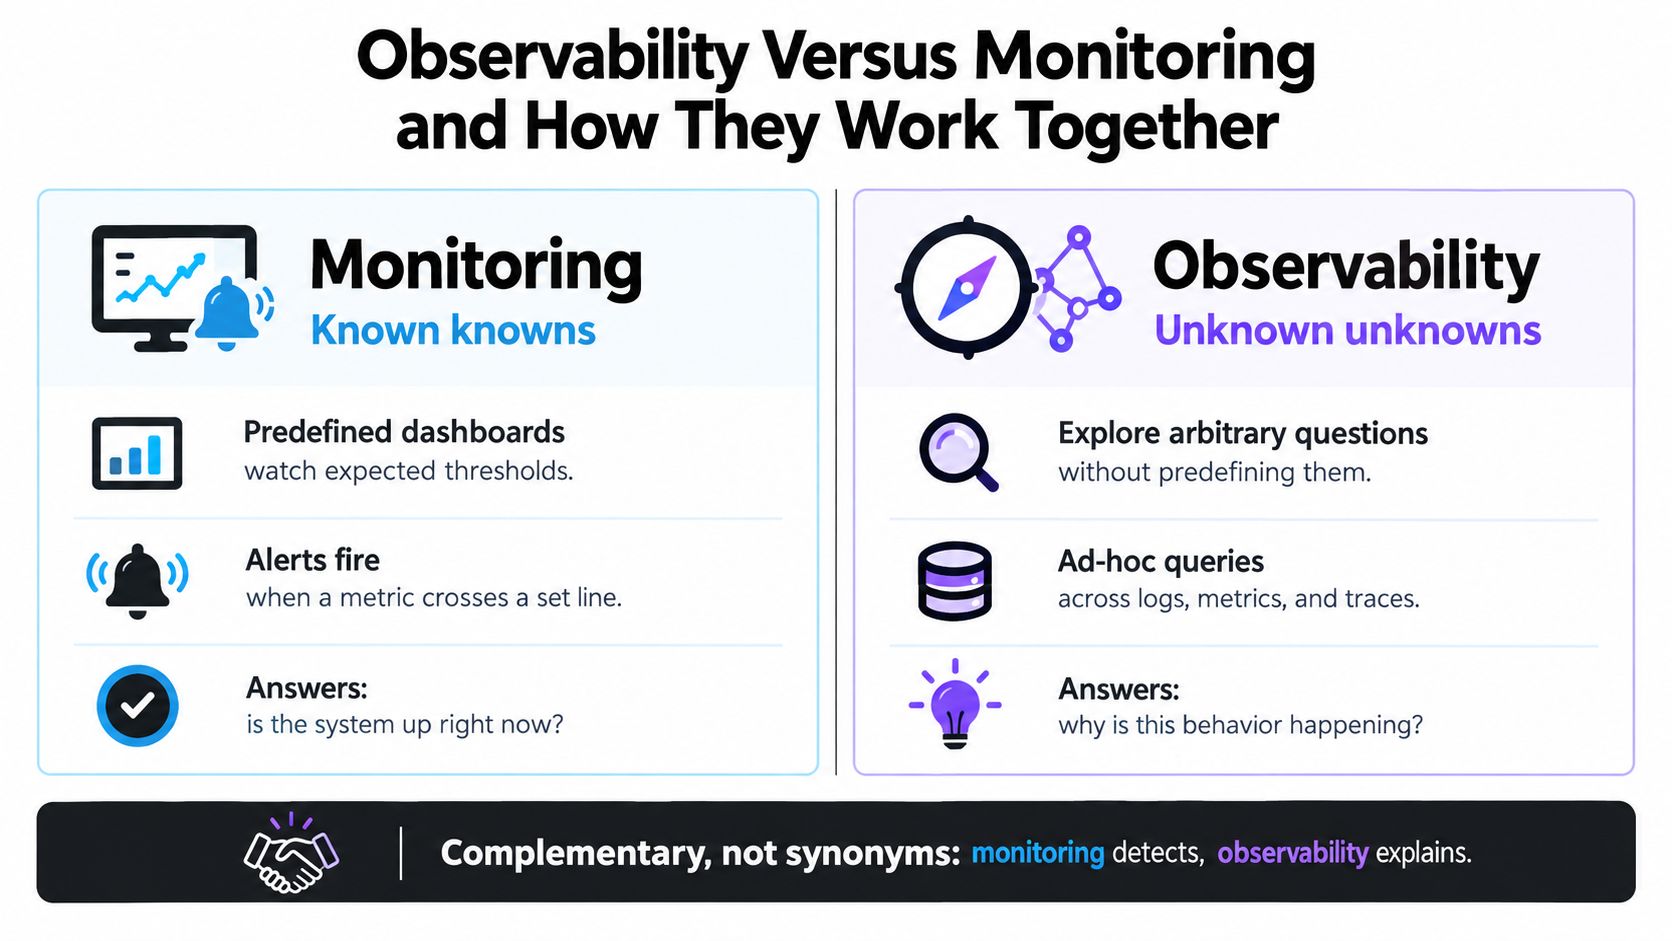
Monitoring and observability support each other, but they aren’t synonyms. Monitoring watches conditions you’ve already decided matter. Observability gives you enough connected data to explore behavior you didn’t anticipate.
A monitoring rule might alert when API latency crosses a threshold or when update failures exceed an expected level. That alert is valuable because it starts the response. It doesn’t necessarily tell you whether the cause is a backend regression, a bad bundle, a regional delivery issue, or a device-specific runtime problem.
| Capability | Monitoring | Observability |
|---|---|---|
| Purpose | Watch known health indicators | Investigate system behavior and unfamiliar failures |
| Question type | “Is this threshold being exceeded?” | “Why is this behavior happening?” |
| Data approach | Predefined dashboards and alerts | Correlated logs, metrics, traces, and context |
| Failure mode | Misses conditions nobody configured | Becomes expensive or noisy without useful instrumentation |
Use both in the incident loop
A healthy operating pattern is straightforward:
- Monitoring detects the signal. An alert identifies unusual latency, error rate, crash activity, or update failure.
- Observability frames the incident. Engineers filter by release, channel, device, platform, region, or user journey.
- Traces localize the fault. The request path reveals the component or span where behavior changed.
- Logs explain the condition. Detailed records show the exception, validation result, dependency response, or configuration involved.
- The team verifies the outcome. Metrics confirm whether the fix restored normal behavior.
Monitoring alone can work well for stable, predictable conditions. Observability becomes more important when systems change often, when failures cross service boundaries, or when users run many combinations of versions and devices.
A mobile team might monitor crash-free sessions and update adoption. When an alert fires, observability lets the team ask whether the problem affects a single channel, a particular application version, or one device class. That investigation is the difference between pausing every release and taking a targeted corrective action.
Capgo’s app health monitoring approach is relevant to this distinction because health signals become more useful when teams can connect them to release and device context. The tool doesn’t replace general infrastructure monitoring. It adds operational evidence around the application lifecycle.
Why Observability Is Now a Business Capability
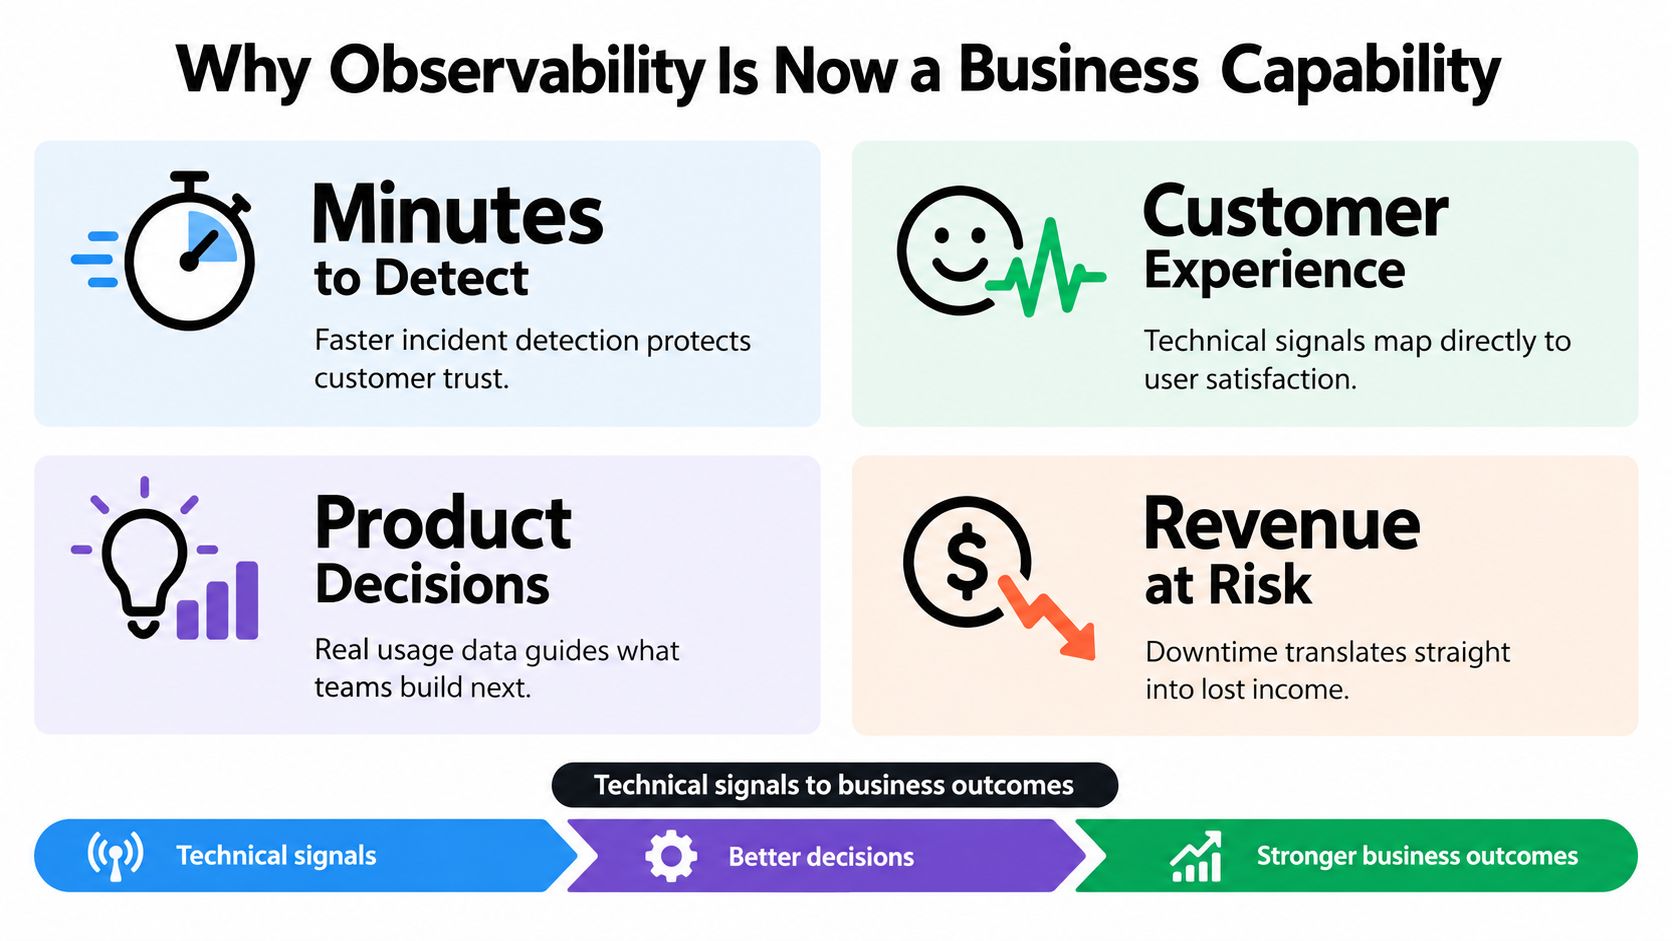
An engineering dashboard becomes a business tool when its signals connect to customer experience and product outcomes. A rising error rate matters because it can prevent a user from completing a purchase, signing in, sending a message, or using a newly released feature.
That connection needs deliberate design. Teams should associate technical events with meaningful business context, while respecting privacy and avoiding unnecessary personal data. A release health view might combine adoption state, failed requests, user-journey completion, and support reports. Product managers can then see whether a feature works for the intended audience, not merely whether the service responds.
Evidence beyond incident response
Splunk reported in 2025 that 74% of respondents rated observability important for monitoring critical business processes and 65% said it was key to understanding user journeys, as described in its State of Observability 2025 report. Those findings point to a wider role. Observability helps teams connect system behavior with the processes customers and employees rely on.
New Relic reported that 68% of organizations measured improved mean time to detect after adopting observability in its 2025 report, available in this New Relic announcement. Faster detection is operationally useful, but the business value appears when teams can show what the detected issue affected and whether the response changed that outcome.
Different groups use the same evidence differently:
- Support teams can identify whether a complaint is isolated to a device, version, or rollout channel.
- Product teams can compare feature behavior across release cohorts and prioritize work using real usage signals.
- Engineering teams can connect a customer-facing symptom to a specific service, request, or client event.
- Leadership teams can evaluate operational risk in terms of critical journeys rather than abstract infrastructure status.
A live-update rollout illustrates the chain. If adoption grows but a subset of users fails activation, the relevant business question isn’t whether the update endpoint is available. It’s whether affected users can complete the task the release was meant to improve. Observability supplies the evidence needed to answer that question and decide whether to continue, pause, or roll back the rollout.
Implementation Patterns Best Practices and Tradeoffs
Good observability starts with questions, not dashboards. Before adding instrumentation, write down the decisions the data must support. For a mobile release, those questions might include: did the device download the bundle, did verification pass, did activation complete, and did the updated app behave correctly afterward?
Instrument the path users actually take
Start with boundaries and outcomes:
- Client lifecycle: Record launch, update check, download, verification, activation, and rollback events.
- Service boundaries: Propagate a trace ID through the app, gateway, backend, and dependent services.
- Failure context: Include app version, bundle version, channel, operating-system version, device class, and error category where appropriate.
- Business actions: Connect technical requests to safe, meaningful events such as sign-in completion or checkout failure.
Use structured logs instead of paragraphs intended only for human reading. Consistent fields make filtering possible. Keep sensitive information out of telemetry, and define retention rules before collection expands.
Trace completeness is a useful benchmark. It means the fraction of total requests that can be reconstructed end to end from distributed tracing data. Research on observability evaluation also identifies fault-detection latency, resource overhead, false positive and false negative rates, and cost as important measures, as discussed in this observability evaluation survey.
Balance diagnostic depth against overhead
More telemetry isn’t automatically better. Collection can consume CPU, memory, bandwidth, and storage, particularly on mobile devices or high-volume services. Sampling helps control volume, but sample deliberately. Keep detailed traces for errors, unusual latency, rollout cohorts, and important workflows, while retaining broader low-cost metrics for trend visibility.
The useful signal is the smallest set of evidence that lets a responder make the next correct decision.
Review the data after an incident. If nobody queried a field, remove it or change its purpose. If engineers still needed to reproduce the issue manually, add the missing context rather than increasing every log level.
For Capacitor teams, a focused performance monitoring setup guide can help translate these principles into client-side instrumentation. Start with one critical user journey, establish its normal behavior, and expand coverage as the team learns which questions recur.
Observability in Action for Capacitor Electron and Capgo Live Updates
A Capacitor or Electron team may need to correct JavaScript, CSS, copy, configuration, or web assets while users continue running installed applications. A live-update lifecycle creates its own observable path: a device checks for an update, receives a bundle from a channel, verifies it, activates it, and reports the result.
Consider a team preparing a JavaScript fix. It publishes the bundle to a staging or beta channel, then assigns a controlled audience. Adoption metrics show whether devices are receiving the release. Failure metrics reveal whether downloads, verification, or activation are failing. Version history identifies which bundle each device should run.
The team then finds a device-specific problem. Per-device logs show that the affected installation downloaded the bundle but failed verification. The engineers can compare the device’s current version, channel, and update history with successful installations instead of treating the issue as a general outage.
Rollouts need guardrails
A safe rollout uses the same tell, locate, explain pattern:
- Metrics tell whether adoption and failure behavior changed.
- Per-device records locate the affected cohort or installation.
- Logs explain the failed download, checksum, activation, or runtime event.
- Channel controls limit the blast radius while the team investigates.
- Rollback protection restores the previous working bundle when the new release is unsafe.
That workflow matters for Electron as well as mobile applications. Desktop users may have different operating-system environments, permissions, network conditions, and installed versions. A release view that identifies the exact active bundle gives support and engineering a shared answer to “what is this user running?”
Teams can also instrument product events alongside update events. Capgo’s custom event tracking plugin supports the broader principle that release telemetry becomes more valuable when it connects deployment state with application behavior. The platform can provide per-device logs, adoption and failure metrics, version history, targeted channels, and automatic rollback protection for JavaScript updates.
Start with one production channel and one critical journey. Define the rollout signals, attach consistent version and device context, test rollback before an incident, and make someone responsible for reviewing the evidence after each release.
Capgo provides live updates for CapacitorJS and Electron applications, with targeted channels, per-device release visibility, adoption and failure metrics, version history, and rollback protection. Use that release observability to connect what changed with what users experience, then visit Capgo to evaluate it for your next update workflow.