Wednesday at 9:12 a.m., your mobile team finds a checkout bug in production. Web can patch it quickly. iOS and Android can’t, at least not through store review. Support starts collecting tickets, product wants a status update, and engineering is trying to answer three different questions at once: how fast can we ship a fix, how fast will users receive it, and how fast can we prove the fix worked?
That’s where cloud app performance stops being an abstract backend topic and becomes a release topic. For hybrid mobile teams shipping JavaScript bundles, config, copy, and asset updates outside the store, performance isn’t just “is the API fast?” It’s whether your delivery path can publish, route, download, validate, apply, observe, and, if needed, roll back an update while users are still in the blast radius.
If you work on Capacitor, Ionic, or another hybrid stack, this changes how you think about performance work. A manifest fetch that stalls, an edge cache serving an old bundle, or a trace that can’t identify where a hotfix failed all become part of the same system. The app experience and the release mechanism are tied together.
Table of Contents
- The Mobile Team That Could Not Ship a Fix
- What Cloud App Performance Really Means
- The Anatomy of Latency in Cloud-Backed Apps
- Edge Networks and CDN Delivery for Mobile Updates
- Metrics That Matter Beyond Average Response Time
- Observability for Cloud Apps Without the Data Swamp
- SLAs, Error Budgets, and Channel-Based Rollouts
- Putting Cloud App Performance into Practice
The Mobile Team That Could Not Ship a Fix
A team I’ve seen many times in practice looks like this: one mobile lead, two app engineers, one backend engineer, a product manager, and support forwarding screenshots from angry users. The bug is simple. A pricing mismatch breaks checkout after a feature flag flips. The fix is also simple. The frustrating part is delivery.
The native shell doesn’t need to change. The JavaScript bundle does. If the team relies only on app store submission, they’re now waiting on a process they can’t control. During that wait, every conversation gets worse. Support asks who’s affected. Product asks when exposure drops. Engineering asks whether users are even reaching the fixed code path.
The delay is not only in coding
First frame this as a release bottleneck. That’s partly true. But the deeper issue is cloud-delivered performance across the entire update path.
For a live update to help, several things must go right:
- The device must reach the update service: If the manifest request is slow or fails intermittently, users stay on the broken version longer.
- The edge must serve the right files: If cache invalidation lags, one country may get the fix while another still downloads stale assets.
- The app must verify and apply safely: Signed bundles, channel targeting, and rollback rules matter as much as raw speed.
- The team must observe adoption: Shipping a fix without seeing who received it is just a more complex form of guessing.
Practical rule: A mobile hotfix is only “shipped” when affected devices have actually downloaded and applied it.
That’s why cloud app performance matters so much for live updates. You’re not only optimizing server response time. You’re optimizing incident recovery time for real devices on uneven networks, in different geographies, running different app versions.
A better question than is the app fast
When teams talk about performance after an incident, they often ask whether the app felt slow. The more useful question is whether the delivery system was fast enough to change the user experience before the incident spread.
For hybrid apps, the release path is part of the product. If your team can publish a corrected bundle quickly, target a channel safely, and verify adoption with confidence, performance becomes operational. It directly affects support load, revenue protection, and how much trust product has in engineering during an outage.
What Cloud App Performance Really Means
When mobile teams hear “performance,” they usually picture load time. That’s only one part of it. Cloud app performance is the combination of four qualities working together: latency, throughput, availability, and consistency.
A good way to teach this is to borrow a shop analogy.
Four qualities you can actually reason about
Latency is the wait at the counter. You ask for something and count how long it takes to get an answer back.
Throughput is how many customers the shop can serve cleanly at once. One fast cashier isn’t enough if a queue forms the moment traffic spikes.
Availability is whether the shop is open at all. A response that never arrives isn’t a slow success. It’s a failed interaction.
Consistency is whether every register sees the same stock level and pricing. If one register says the item exists and another says it doesn’t, the customer experiences confusion, not just delay.
A historical benchmark helps ground the first and third terms. A CloudOps analysis reported a worldwide average of 426.4 milliseconds to complete an HTTP request and receive a response, with average availability at 97.69% according to Google Cloud Observability. Those two numbers matter because users feel both the delay and the downtime, even when the service is “mostly up.”
Why mobile update delivery depends on all four
For live updates, latency is the time to fetch the manifest and bundle. Throughput is whether the service still behaves under a surge when many devices check for updates at launch. Availability is whether devices can reach the update endpoint at all during an incident. Consistency is whether devices in different places get the same intended release channel and asset set.
App architecture starts to matter. If you’re mapping out the moving parts between app code, storage, CDN, edge logic, and release channels, a practical primer on mobile app infrastructure helps connect the delivery pipeline to the user experience.
The common confusion
Teams often bundle all four into one complaint: “updates are slow.” But those are different failures with different owners.
- High latency: the request works, but users wait
- Low throughput: requests pile up during bursts
- Poor availability: the service isn’t reachable
- Weak consistency: users receive mismatched state or stale versions
If you separate those four early, incident review gets much sharper. You stop arguing about “the network” and start identifying the exact layer that failed.
For mobile teams, that distinction matters because update systems are multi-step systems. A bundle can be small, signed, and correct, yet still reach users too slowly if any one of those qualities degrades.
The Anatomy of Latency in Cloud-Backed Apps
User-perceived delay is rarely one thing. It’s a stack of small waits that add up. When a hybrid app checks for a live update, the user doesn’t see DNS, TLS, network travel, manifest generation, signature validation, file download, disk write, and JavaScript evaluation as separate events. They feel one pause.
That’s why latency work should be treated like a budget.
Where the waiting time comes from
The first layer is connection setup. DNS resolution and the TLS handshake often happen before your application logic runs. Then comes the network round trip to the nearest delivery point. After that, the backend or edge logic still has to decide which manifest and which bundle this device should receive. Finally, the device has to unpack and evaluate what it downloaded.
Use this as a working model:
| Layer | Typical Range (ms) | Optimization Lever |
|---|---|---|
| DNS and TLS setup | 50 to 150 | Connection reuse, HTTP keep-alive, TLS session resumption |
| Network RTT to delivery point | 10 to 80 | Regional placement, CDN routing, edge cache hit rate |
| Origin or edge processing | 20 to 300 | Lean manifest generation, precomputed metadata, faster storage lookups |
| Device-side apply and render | 100 to 600 | Smaller bundles, pre-warmed JS engine, less startup work |
If you want a grounding in the network portion specifically, this explainer on network latency in application delivery is useful for non-network specialists on mobile teams.
Geography helps, but not by itself
A widely cited reachability study found that the majority of the world’s population could access a cloud facility within 100 milliseconds, which helps explain why regional deployment became central to performance strategy, as summarized in this cloud reachability discussion. That’s encouraging, but it doesn’t mean every user automatically gets a fast update path.
Another study makes the trap clear. Edge sites can reduce network latency, but constrained resources at the edge can create queueing delay, causing cases where the cloud is faster overall, according to this edge versus cloud latency analysis.
What mobile teams should tune first
Start with the layers that are easiest to change without rewriting the app:
- Cache the manifest at the edge carefully: Short TTLs and explicit invalidation are usually safer than hoping propagation behaves perfectly during a hotfix.
- Precompute release metadata: Don’t build a complex manifest on every request if channel, version, and signature data can be prepared ahead of time.
- Reduce startup work in the app: A bundle that downloads quickly but takes too long to evaluate still feels slow.
- Reuse connections where possible: Repeated setup cost adds visible drag on flaky mobile networks.
A “fast bundle download” doesn’t guarantee a fast update. The user only cares when the new code is actually ready to run.
Edge Networks and CDN Delivery for Mobile Updates
A single cloud region can work well for internal tools or one-country apps. It becomes harder to defend when your user base is spread across continents and you need hotfixes to land quickly. For mobile update delivery, edge and CDN design determine who gets the first byte fast, who gets stale content, and who falls back to origin at exactly the wrong moment.
Three delivery models teams usually consider
The simplest model is centralized origin delivery. Devices fetch manifests and bundles from one region. It’s straightforward to operate, easy to reason about, and often good enough early on.
The next step is regional delivery. You place storage or application logic in a few major regions and route users to the nearest one. This lowers transit distance for many users and spreads load better.
Then there’s edge delivery. Static bundles are cached near users, and lightweight logic at the edge can rewrite manifests, route channels, or perform signature-related checks before the request reaches origin.
Here’s a practical comparison:
| Model | Typical P50 First Byte | Cache Invalidation Effort | Best Fit |
|---|---|---|---|
| Centralized cloud region | Higher for distant users | Low | Small footprint, low release frequency |
| Regional deployments | Moderate | Medium | Multi-region apps with predictable user clusters |
| Edge delivery with CDN and edge logic | Lowest when cache hits are healthy | High | Global apps, frequent updates, incident-sensitive releases |
For teams evaluating the mechanics, this guide to edge networks in app delivery gives the right mental model.
The part teams underestimate
Cache invalidation sounds like a solved problem until a critical fix ships. Then the edge serves yesterday’s manifest in one geography, today’s manifest in another, and support gets reports that “the fix works for some users.”
That’s not a theoretical annoyance. It’s a release integrity problem.
A thesis on edge placement found that moving compute closer to users often improved access latency by only about 6% to 30%, and also noted that alternate network paths can outperform a nominally local route by up to 40%, which means routing quality and peering can matter as much as physical proximity in the tail of user experience, according to this large-scale edge performance thesis.
A decision matrix for mobile teams
Use these criteria when picking your update delivery tier:
- User distribution: If users cluster in one country, centralized or regional delivery may be enough.
- Release frequency: Teams that ship often benefit more from edge caching, but they also inherit stricter cache discipline.
- Hotfix cost: If a stale bundle during an incident is expensive, build for explicit invalidation and rollback before you need it.
- Operational tolerance: Edge logic adds power, but also more places for routing bugs, signature mismatch handling, and geo-specific surprises.
The right answer isn’t “always use edge.” The right answer is to match delivery architecture to the speed and blast radius your release process demands.
Metrics That Matter Beyond Average Response Time
Average response time is useful for dashboards and almost useless for arguing about user pain. Mobile users don’t experience the average request. They experience their request, on their device, on their network, at the moment they opened the app after you pushed a hotfix.
That’s why tail metrics matter more.
The three views I’d put in front of a product manager
Start with cold and warm start latency at P95 and P99. Cold start tells you what happens when the app launches fresh and checks for updates with no warm state to help. Warm start tells you how much friction remains once the app has already done some work.
Right below that, track Apdex with a threshold your mobile team believes. A threshold that might feel fair for desktop web can be wrong for a hybrid app startup path.
Then track error budget burn. This shifts the conversation from “did an alert fire?” to “how quickly are we consuming the reliability room we agreed to spend?”
Here’s a compact visual worth sharing in weekly review:
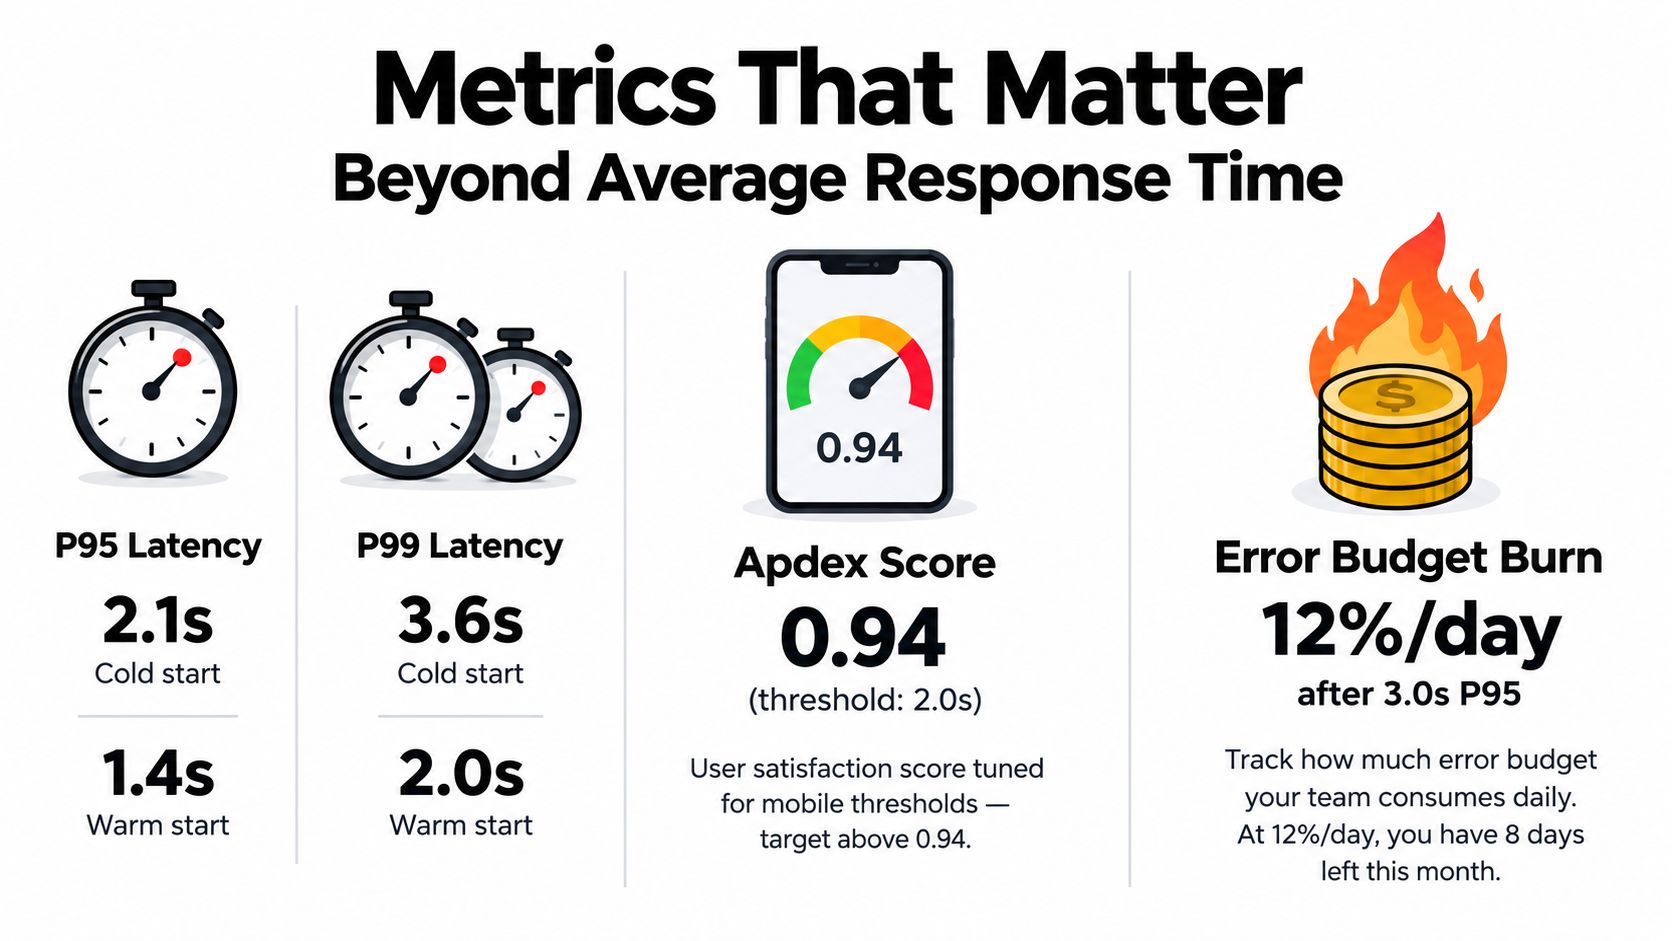
Metrics that connect performance to release outcomes
Add one delivery-specific metric that web teams often don’t need: adoption rate by release channel. If a fixed bundle was published but affected devices are still on the previous version, that’s a performance and delivery issue at the same time.
Segment your metrics by:
- Device class: Older phones often reveal startup and evaluation costs first.
- Network type: Wi-Fi can hide bad bundle design that mobile data exposes immediately.
- App version: Some failures are version-specific, especially around bridge behavior or migration logic.
This video is a good companion if your team needs a practical refresher on how to interpret performance telemetry instead of staring at averages:
One caution about reading noise
Not every small movement in cloud app performance is meaningful. A large longitudinal study across 2,366 benchmarks on 789 AWS Kubernetes clusters found overall variability below 3.7%, with subtle time-of-day and weekend effects, according to this cloud performance variability study. That’s a useful reminder to avoid overreacting to tiny swings while still taking tail regressions seriously.
Don’t ask whether cloud performance is random. Ask what normal measurement noise looks like for your system, then alert on changes that exceed it.
Observability for Cloud Apps Without the Data Swamp
Many engineers have telemetry, but it often can’t answer the on-call question fast enough. For hybrid mobile updates, the useful question is usually specific: why did this device stay on the old bundle, why did the new one fail to apply, or why did startup get slower after a release?
Traces, logs, and metrics are necessary. They’re often not sufficient.
Build the stack around one release path
A practical observability stack for cloud app performance should let you follow one update attempt from the device to the backend and back again.
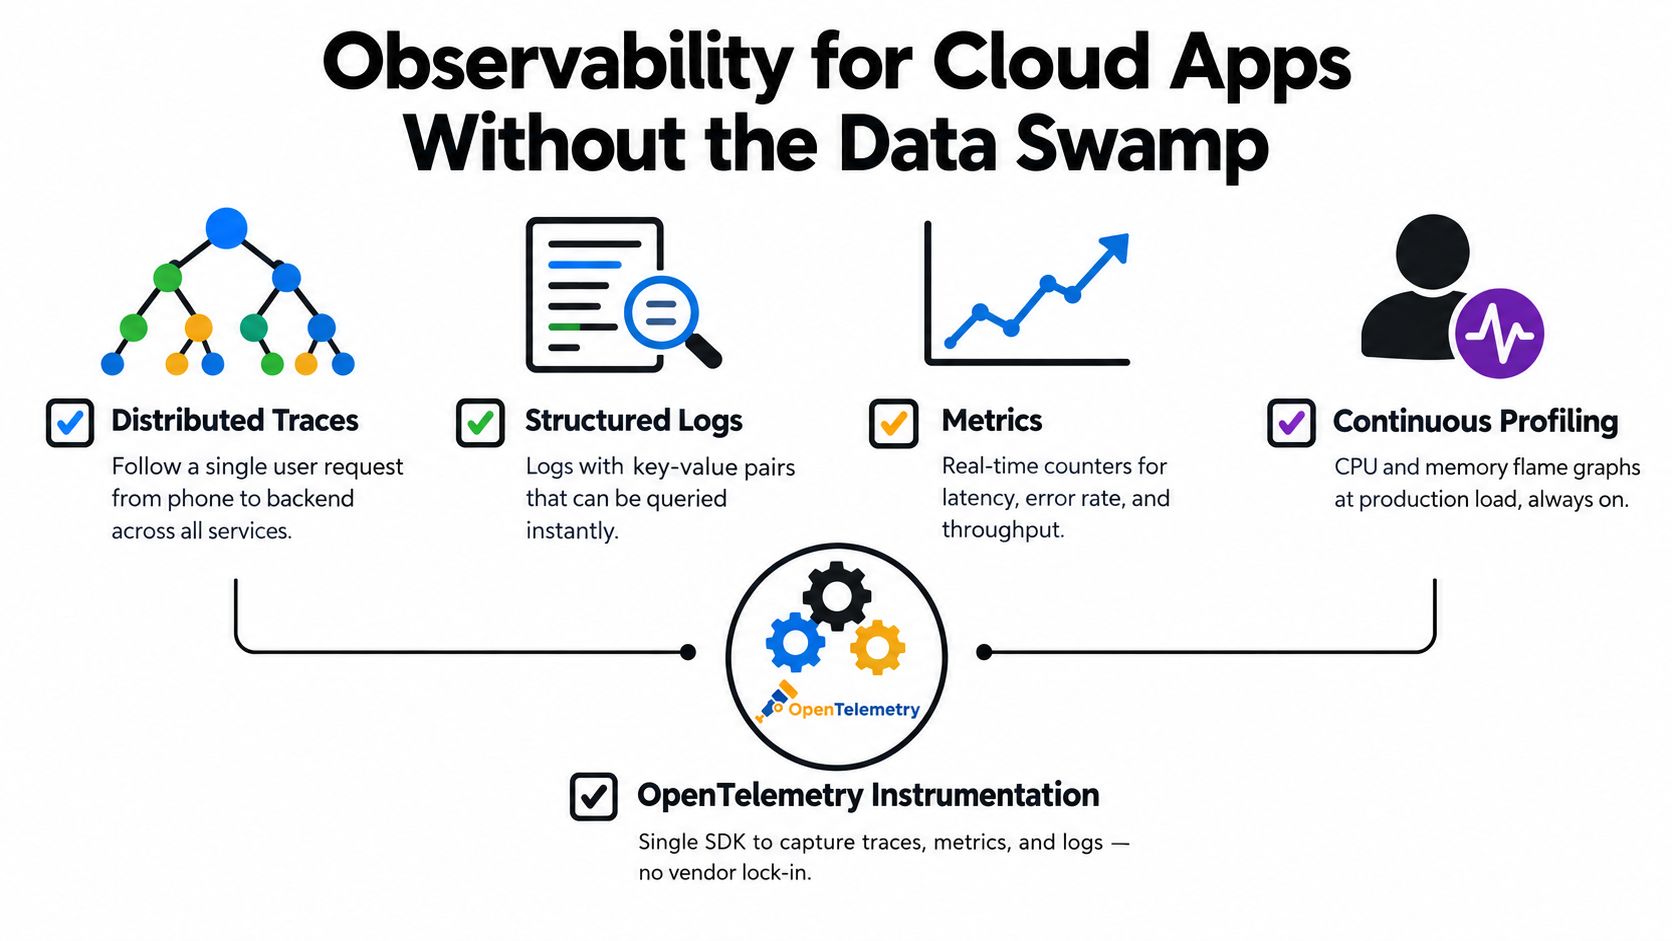
Instrument the mobile bridge and update client with OpenTelemetry tags for app version, release channel, platform, and update result. Structure logs so you can query one update ID or one device session without fuzzy text search. Keep metrics focused on latency, error rate, adoption, and rollback events.
For teams standardizing these pieces, this overview of application observability for shipped apps is a good implementation reference.
The missing fourth signal
One of the most useful shifts in modern APM guidance is the idea that traces, metrics, and logs still leave a diagnosis gap. Continuous profiling is increasingly treated as the fourth signal because it shows the exact function consuming CPU, memory, or lock time, as described in this guide to application performance monitoring and profiling.
That matters in live update workflows. A trace might show that “apply update” took too long. Profiling can show whether the bottleneck was bundle decompression, JSON parsing, bridge initialization, or a lock in a startup path.
Keep the system legible at 2 a.m.
Use a small, disciplined set of views:
- Release channel dashboard: adoption, failures, rollback count
- Update transaction trace: manifest fetch to bundle evaluation
- Top startup regressions: grouped by app version and platform
- Profiling view: hottest functions during update apply and first render
If your team is refining its broader DevOps and SRE operating model around these workflows, it’s useful to see how nexus IT group delivers devops because the case study frames observability as an operating practice rather than just a tool purchase.
The best dashboard is the one an on-call engineer actually opens, understands, and acts on before support writes the incident summary for them.
SLAs, Error Budgets, and Channel-Based Rollouts
SLA language sounds clean in a contract and messy in production. Mobile teams usually discover that during a bad release. “High availability” feels comforting until you have to decide whether to keep shipping updates while users in one region can’t fetch the current bundle.
Turn availability targets into release policy
Use availability targets to define rollout stages, not just customer promises.
| Availability Target | Monthly Downtime Budget | Suitable Rollout Stage |
|---|---|---|
| 99% | About 7 hours 18 minutes | Internal and experimental channels |
| 99.9% | About 43 minutes | Beta and staged production rollout |
| 99.99% | About 4 minutes 23 seconds | Broad production for business-critical paths |
Those downtime budgets come from simple monthly math. They also shrink in practice once you account for the entire delivery chain. Your origin may be healthy while DNS, edge propagation, or a bad channel rule still prevents devices from getting the intended release.
If you need a concrete example of how an update platform frames this operationally, review the Capgo service level agreement and compare it against your own incident assumptions.
Error budgets are where product and reliability finally meet
An error budget gives the team permission structure. If burn is calm, you can accept some release risk. If burn spikes after a hotfix, pause promotion to the next channel.
A strong rollout ladder for hybrid apps usually looks like this:
- Internal: engineers validate that the manifest, signature, and apply flow behave as expected
- Beta: friendly users and testers catch edge-device failures
- Staged production: a limited audience receives the bundle first
- Full production: the update becomes the default channel target
The same discipline applies whether you use feature flags, over-the-air JavaScript updates, or both.
Set rollback triggers before you need them
Rollback rules should be explicit and boring. Don’t improvise them during an incident.
Useful triggers include:
- Adoption stalls unexpectedly: devices are checking in but not moving to the new bundle
- Startup latency regresses sharply in tail users: especially older devices or weaker networks
- Apply failures cluster on one platform or version: often a bridge or packaging mismatch
- Real user monitoring shows degraded experience: synthetic checks can miss mobile-specific pain
Communicate breaches in plain language. Say what failed, who was affected, what channel was paused, what rollback occurred, and when the next decision point is. Stakeholders don’t need a telemetry dump. They need operational clarity.
Putting Cloud App Performance into Practice
The fastest way to improve cloud app performance is to stop treating it as an infrastructure vanity project. Users don’t care about your cache hit ratio unless it changes what they feel. Product doesn’t care about origin CPU unless it changes how quickly a fix reaches affected devices.
Pick one user-facing metric this week and make it real.
A one-week challenge worth doing
Choose a metric with clear user impact. Good options include first-launch time to interactive after an update check, or update bundle download time for the slowest users in a production channel.
Then do four things:
- Measure a baseline: Use real user monitoring, not only synthetic checks.
- Make one targeted change: For example, shrink bundle size, precompute manifest output, or tighten edge caching rules.
- Ship through a staged channel: Watch adoption and failures before broad rollout.
- Remeasure the same metric: If the user-visible outcome didn’t improve, the optimization wasn’t worth much.
This checklist captures the right priority order for most mobile teams:
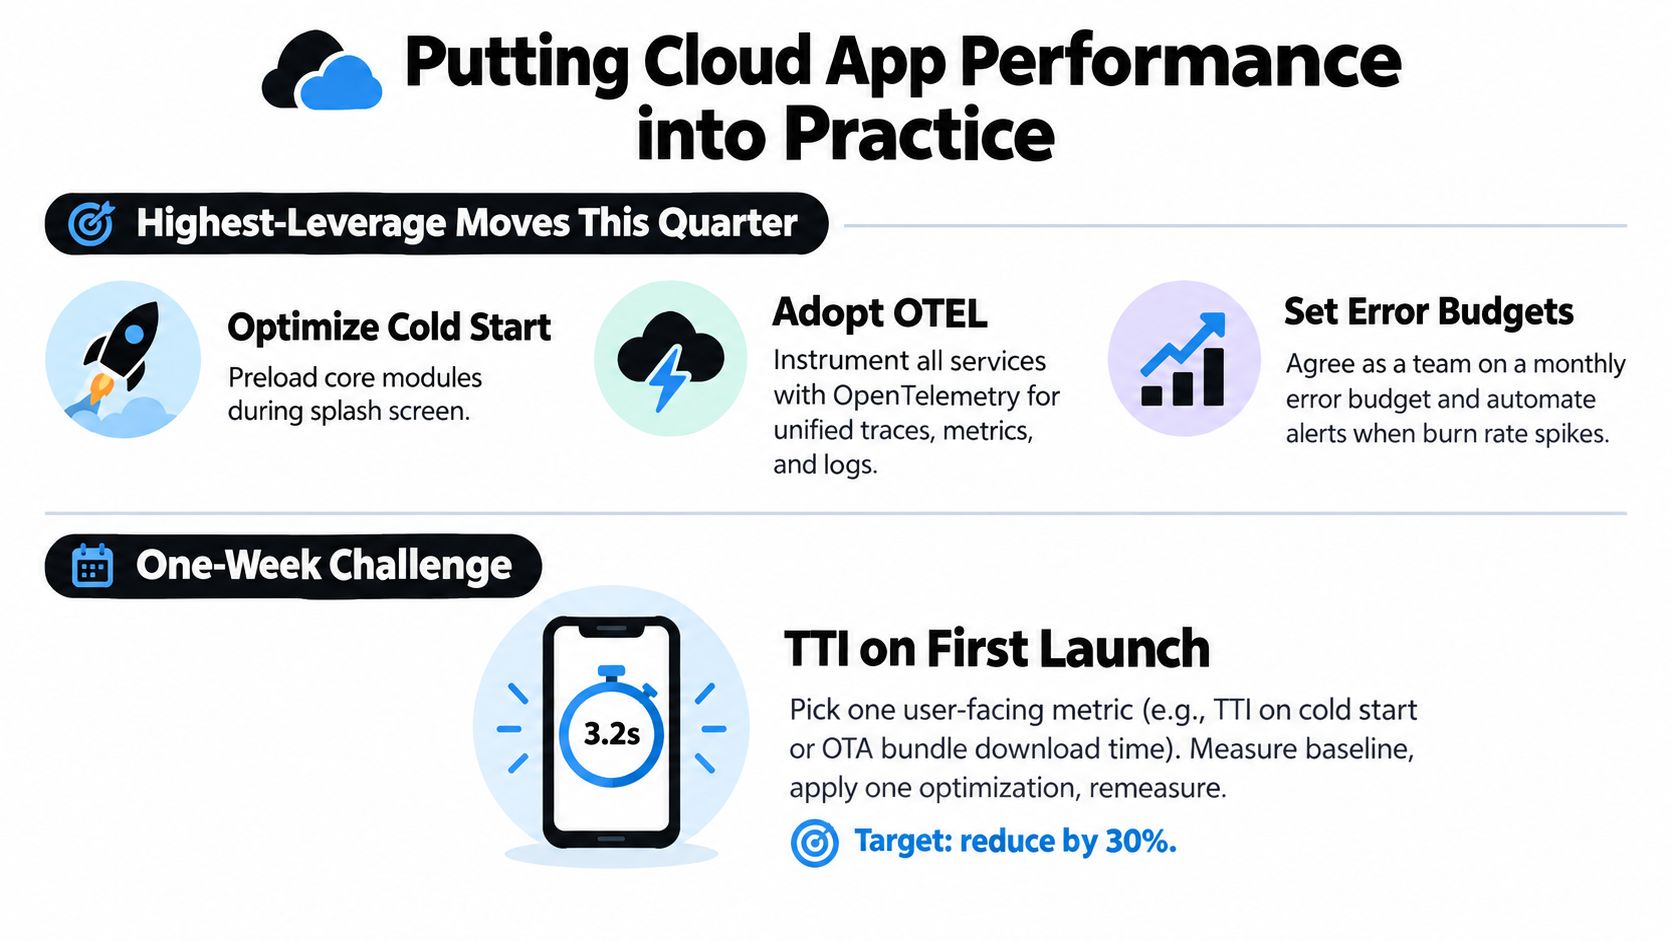
What I’d prioritize this quarter
Start with the work that reduces incident pain fastest:
- Validate edge cache behavior: Make sure manifest freshness and bundle invalidation behave the way your runbook assumes.
- Audit bundle size and startup cost: Delivery speed and evaluation speed both matter.
- Build P95 dashboards for update flow: Don’t stop at averages.
- Track error budget burn by channel: Reliability and release velocity should share the same scoreboard.
- Write the rollback runbook: Include triggers, owners, and communication steps.
If you need an actual tool example in this category, Capgo is one option for Capacitor and Electron teams that need signed live updates, channel-based rollout control, per-device logs, and rollback support delivered over a global edge network. The important part isn’t the vendor name. It’s choosing a workflow where you can publish, observe, and reverse an update without waiting for store review when the issue lives in web-delivered code.
Disciplined measurement beats heroic engineering. It’s better to move one visible metric in a week than to spend a quarter polishing backend numbers that never change what users experience.
If your team ships Capacitor apps and wants tighter control over live update delivery, observability, staged rollouts, and rollback safety, Capgo is built for that workflow. It lets you deliver signed JavaScript, CSS, config, and asset updates outside store review, then track adoption and failures closely enough to make cloud app performance operational instead of theoretical.